How can I load the contents of a VIEW from SQL Server into a new Excel file?
Use these steps to load the contents of a View from SQL Server into a new Excel file, or to update an existing file with the current data.
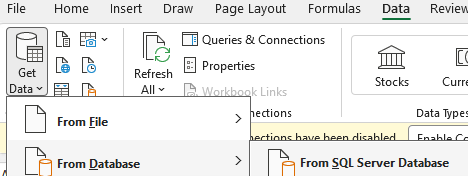
• Open Excel file and go to Data --> Get Data --> From Database --> From SQL Server Database.
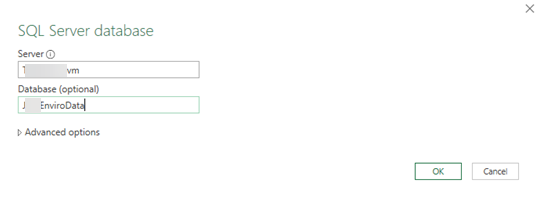
• Enter Server and Database names
Server = servername
Database = databasename
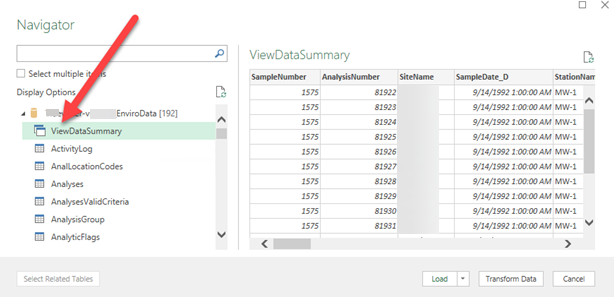
• Select ViewDataSummary on the Navigator pane, and then click the Load button below the datasheet view.
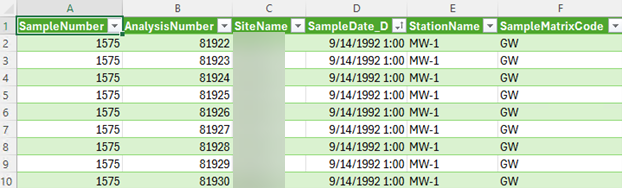
• The contents of the SQL Server view will be loaded onto the worksheet adfter a short wait.
How can I run a simple report in Enviro Data?
Enviro Data ships with many prepared reports available from the Select Data form’s Report button. These are often referred to as the “canned” or “Access” reports and have been created using MS Access. Specific requirements and example queries on how to run these reports are provided in Appendix C – Reports of the User Documentation.
The instructions below are to create one of the common run reports in Enviro Data, the Periodic Regulatory Report with Limits. This report requires that Regulatory Limits are set in the Display Option form as shown below. You can access this by clicking on Display Options at the top-center of the Select Data form. It is near the bottom of the form.

To run this report, click on the Save/Load tab, select "9 Graphs" from the Saved Query combo box.
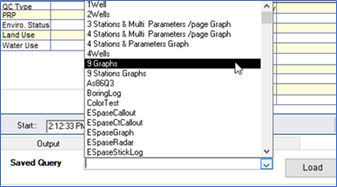
This is a simple set of selected data that will be used for this report. Once you have made the selection, the Report button will be displayed if it was not already shown.
Click on Report to bring up the Select Report form. On the left side of this form are a list of the available reports. (Note that these can be turned on or off from the Editor as needed.) On the right side are screen shots showing the report layout. Use your mouse or the down arrow on your keyboard to move up or down the list. Notice that the previews to the right change as you scroll. There are also Tabs for each report you can use for custom labels. There are about sixty report formats available for different project needs. For example, one report creates a simple boring log display. Several reports let you create multiple graphs on a page of the data selected. Like the one you will be creating, many of the reports are a type of “crosstab” format, such as with samples across and parameters down, or vice versa. (There are other and more complex customizable crosstabs "exports; available elsewhere in Enviro Data.)
Select Periodic Regulatory Report with Limits. You will probably need to scroll down the list to find it.
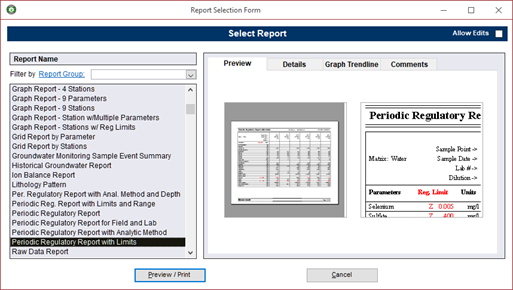
Next click on Preview/Print to build the report.
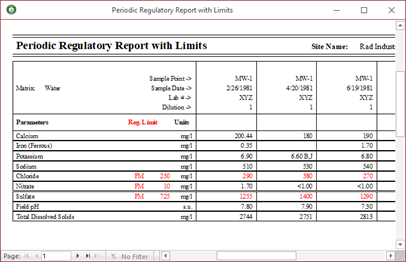
Double-click on the report's title bar at the top of the report. This will maximize the report to fill the entire Access window then click inside the report to zoom in. Since there are multiple pages in this report, you can move through the pages using the Access Record Selector in the lower left of the report. This tool has first, last, page advance and page back buttons. (There is also a new page button for use on other forms.)

In the record selection, click on the last page button “>|” This page also has a legend at the bottom to display the regulatory limit type codes and any analytic flags used in the report.

. Click on the first page button "|< " to return to the first page.
This report highlights several useful features of the software. It highlights regulatory limit exceedances by turning them red. Notice that the second Potassium result shows both the value and the “BJ” flag. Also, many Nitrate values are displayed as “<1.00.” These are examples of the value and flag formatting feature described above. Also, the regulatory limit for pH has both an upper and lower limit. Enviro Data can handle upper limits, lower limits, or both. Finally, note that many the results have trailing zeros, such as “6.90.” Enviro Data helps you display your data with the number of significant figures the result was imported with or the significant figures in the detection limit.
At this point, you can print the report if you want using the Access Print button in the upper left of the Access Menu bar below. You can then choose a printer or print to PDF.

You can close the report preview but clicking Close Print Preview in the Access Menu bar of simply click the X in the upper right.
Because you clicked in the report to maximize it above, that Select Data form looks different as it is now maximized. You can restore it to the original windowed view by clicking on the the Windows control on the second row of icons in the upper-right.
Note that Enviro Data runs best when program forms are windowed and not maximized.
How can I as an administrator allow my users to only display the reports required for my project?
The Manage Reports form, in the Editor only, provides a way to turn on and off reports in Enviro Data. It also allows you to edit report comments, entering starting page numbers, adding logos, and assigning reports to a Report Group. To get to this form, in the Editor, click on Manage Reports on the Maintain Database form.
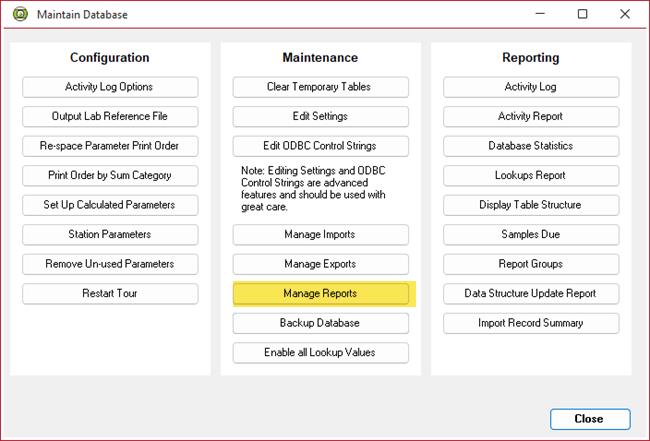
This form is only recommended for advance users because it can turn off a report so that it will not display in any list for some or all users and/or cause it to not display a report as intended.
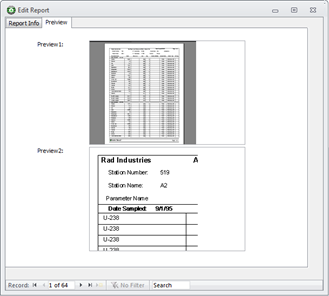
There are two tabs on the Manage Reports form; Report Info and Preview.
On the Report Info tab (below) are a number of options many of which would never be changes. However, the Status is where you can turn on or off individual reports.
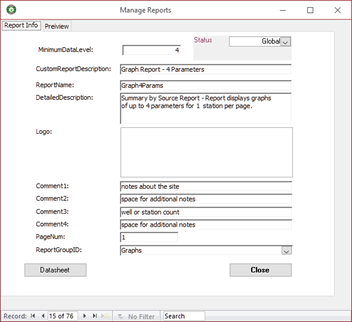
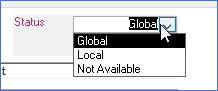
Status - This dropdown on the upper right permits administrators to control the availability of the reports to groups of users. Selecting “Global” makes the report available to all users. If you select “Not Available,” the report will not be displayed in the list of available reports in the Viewer’s Select Report Option form.
Datasheet – As in other Enviro Data forms, this can be used to view the reports table and make changes directly to the table.
The Edit Info tab (below) displays a preview of the output of the report selected. Typically, these graphics should not be changed without guidance from Geotech support.
For more information on the Manage Reports form please see the User Documentation.
Can I customize the Templates used for Crosstabs and other reports for my company or client?
Editing an Enviro Data Template File
Enviro Data provides many custom templates for use in formatting reports. These are stored in the C:\Enviro\EDate8\Templates folders and can include company logos, custom fonts, margins, etc. These template files are in Excel Macro format. Instruction for modifying one of the template files using Excel is below. These templates contain Visual Basic for Applications code that is easily broken if you do not know what you are doing. However, if you are not comfortable making changes, Geotech will make changes for you under your paid support plan.
For using Crosstab Template see How can I create a custom header and footer on my tables in my Crosstab Exports? under Using Enviro Data --> Crosstab Export in the FAQs..
Before starting to edit a template, MAKE A BACKUP COPY! This can be done by opening it in Excel from and use File --> Save As appending the original name with BACKUP to the end of the filename. You could include the date if desired.
Configuring Excel Developer Mode
To change the font and font size in the data rows of the export open the XLSM template file in Excel. These changes will be done using Excel’s Visual Basic Editor. On the Excel menu you will need to open the Developer tab in Excel. If the Developer tab is not displayed by default, you can add it to the ribbon using these simple instructions. Go to File --> Options --> Customize Ribbon then on the right, select Developer and click OK.
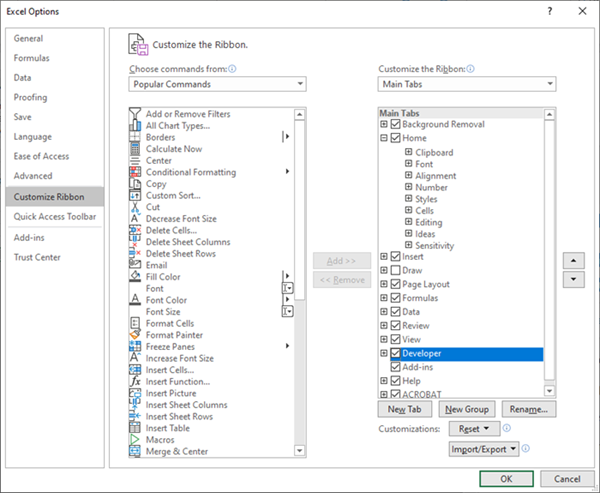
Figure 1. Adding the Developer Menu to Excel to allow for editing Crosstab templates.
Saving and Compile After Changes
Whenever you make changes, especially to the VBA code, you must ALWAYS Save first and then Compile the template file. It also does not hurt to click Save at any time but before you close out, it needs both. For crosstab reports you also need to add the file name and description to that database.
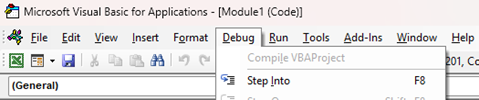
Figure 2. Debug Complie Menu
TO save your changes click on File --> Save. Next, Click on Debug and then Compile VBA Project.
.Making Changes
When you open a template, you will see two workbooks, one for TitleRows (header) and one for Footnotes (footer).

Figure 3. Multiple workbooks in Excel template file.
These workbooks are where you can make modifications to the text and/or add or remove rows. When you are finished making modifications make sure you Save As in the C:\Enviro\EData8\Templates folder\Xtab_Template_yourname.xlsm format.
NOTE: Both workbooks contain a cell in the bottom row of Column A with “/End” as shown below. These must be present at this location for the template to control printing and formatting.
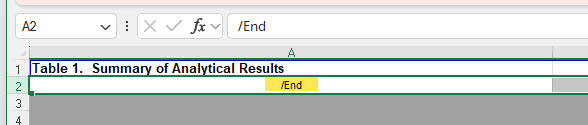
Figure 4. "/End" in last row of each workbook
Even if you already entered a name for the crosstab in the Report Title text box at the bottom of the Crosstab Wizard form, the name of the template file takes priority.
Changing Fonts and Text
Click on the Developer tab in Excel and then click on Visual Basic on the far left of the ribbon.
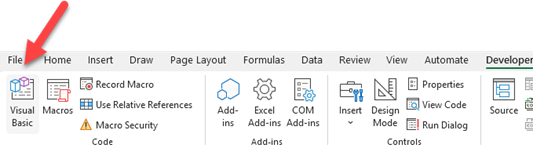
Figure 5. Enter Visual Basic Editor in Developer Mode of Excel
Next, scroll down in the VBA code to the font section. Following the example below, change the font name and size as needed. Be sure to keep the font name in quotation marks.
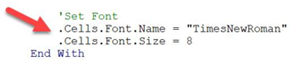
Figure 6 Format of Font Code in VBA
Edit Margins in Templates
It is possible to modify the margins in any of the crosstab templates if needed. To do this first set the Margins (under Page Layout) desired in the TitleRows worksheet. Next, copy the following VBA code into Page Setup section at the bottom of the VBA module.
Margins
wks.PageSetup.TopMargin = Application.Worksheets("TitleRows").PageSetup.TopMargin
wks.PageSetup.BottomMargin = Application.Worksheets("TitleRows").PageSetup.BottomMargin
wks.PageSetup.LeftMargin = Application.Worksheets("TitleRows").PageSetup.LeftMargin
wks.PageSetup.RightMargin = Application.Worksheets("TitleRows").PageSetup.RightMargin
Make sure you Save the template and Compile it after making the above changes.
Editing Text in Header and Footer
We do not recommend changing headers and footers unless the client request this as this is easily done in the final product by your client To change fonts, font sizes and text on header and footer rows, highlight the rows on the TitleRows or FootNotes worksheet that you want to change and use the font and size dropdowns to customize the fonts.
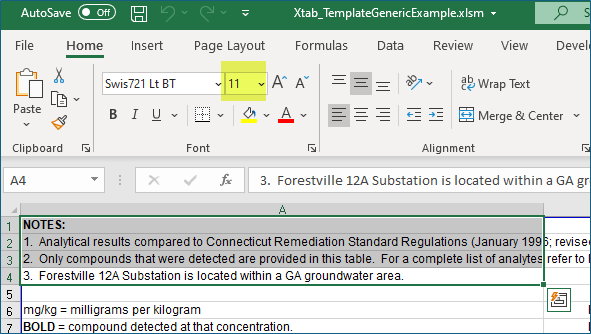
Figure 7. Changing text in Headers and Footers in Excel Template file
The FootNotes worksheet can have up to 100 rows of notes. The last row that contains text on the TitleRows and FootNotes must be “/End”. This marker is used by the export to control printing and formatting.
Make sure to Save changes when finished and, if this is a new template see How can I create a custom header and footer on my tables in my Crosstab Exports? under Using Enviro Data --> Crosstab Export in the FAQs.