iFAQ Search
Using Enviro Data
Crosstab Export
Some parameter’s values cannot be saved in a numerical field. These values might be based on qualitative characteristics such as colors, ignitability, effervescence, or something else that doesn't have a number value associated with it. (This doesn't mean that categorical data cannot have numerical values however,) In these situations, result values can be imported using the CatResults field found in the DTS8 or a User-Defined import. These values will be stored in Analyses,CatResult field and the Value field is left empty.
Before you can use a Cat. Results, they must be in the CategoricalResultType lookup table with the parameter they represent and the meaning. Note that these must each be a unique record set containing the Parameter, Cat Result and CatResultMeaning. Cat. Results can be edited and added using the Cat. Result Types button in the Miscellaneous section of Manage Lookups form in the Editor.
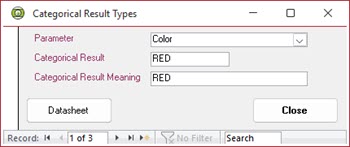
Categorical Result Types form.
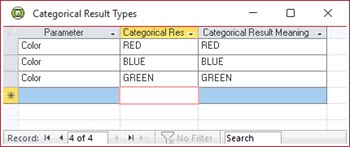
Categorical Result Types form in Datasheet view.
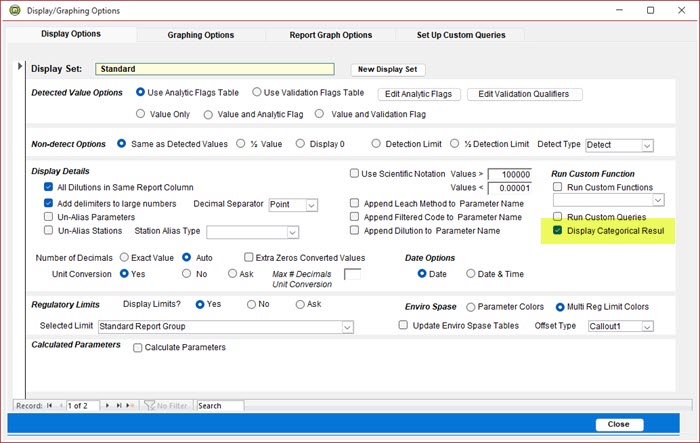
To display an analysis with cat. results, check the Display Categorical Result in the Display Options form as shown below.
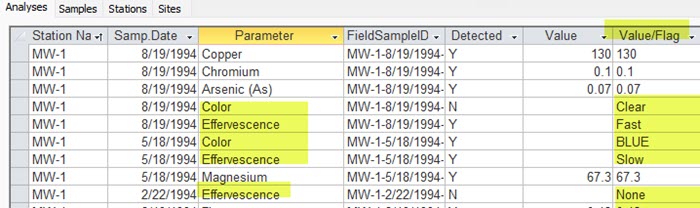
Cat. Results are shown in the Value and Flag column when doing a List in Select Data.
Note: Enviro Data Versions prior to 8D, had an indexing error in the CategoricalResultType table that prevented the storage of the same CatResult with more than one parameter. Contact Geotech Support for a fix if you encounter this issue.
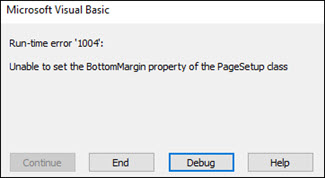
The Crosstab Export in Enviro Data Version 2012 B 1.987 and Version 8 uses Microsoft Visual Basic for Applications (VBA) in Excel to create the final spreadsheet report. When the export is run, a VBA macro attempts to set or get the printer page setup properties for the sheet(s) in the Excel workbook. If a printer is not installed, an error will occur as Excel cannot set the page setup properties. See here for more details.
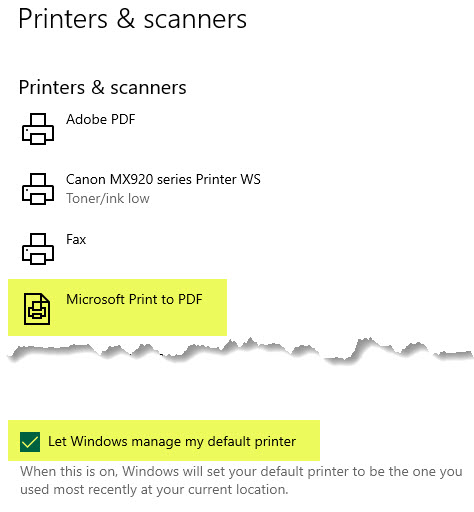
To correct this error when you already have a printer installed, you need to make that printer the default. If you do not have an installed printer, add a printer to Windows and make it the default printer. We recommend setting as a printer the Microsoft Print to PDF.
To change or set the printer In Windows 10 open Settings --> Devices --> Printers & Scanners and select/install a printer. Generally, you should let Windows 10 manage the default printer. To allow this, check the check box shown at the bottom of the figure below.
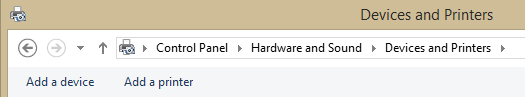
In older versions of Windows, the settings to add a printer and make it the default may be found in the Control Panel.
When retrieving a large number of samples to produce a crosstab, you may encounter the following error.
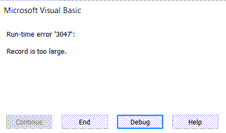
A query can be only 1000 character wide. When the crosstab export runs it attempts to group column information and build queries to fall within this limit. The text in a query can be only 1000 character wide. Currently the crosstab export pulls 150 columns for each query. So, if you select a large number of samples, the export may actually run 3 queries to put the data on the Excel sheet.
This problem can occur in cases where the FieldSampleIDs and/or other information are very long, or if you have a lot of reg limit exceedances, since the background color is part of the data export.
The solution is to reduce the number of samples selected, check field sample IDs, and other items to reduce the size of the query.
Other factors may also be in play in that the VIEWER may need some maintenance. To correct this go to Maintain Database --> and click Clear Temporary Tables then on the Access menu go to Database Tools and click Compact and Repair Database.
Crosstab Export Templates
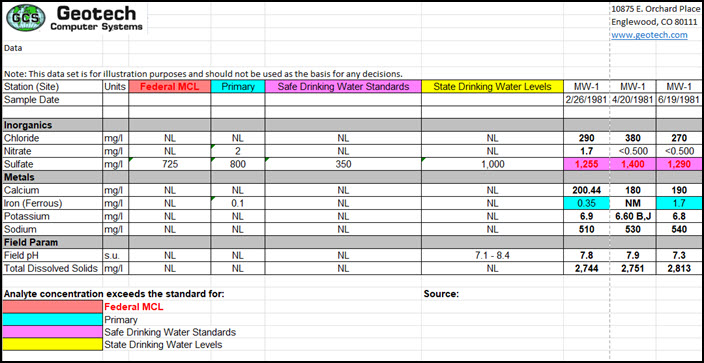
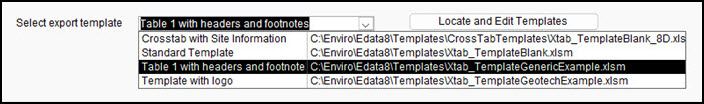
The crosstab export now permits selection from multiple customizable crosstab templates that can display site name and address and station name information. Custom logos can also be printed on the Excel reports. Templates features and examples including their output, are provided below and allow you to use a custom headers and footers with the crosstab. How to set templates up and modify them is outlined below along with samples of each templated provided. Note that while you must select an Export Template, you can choose a blank one from the Select Export Template dropdown shown below. If none are shown, click Locate to select one.
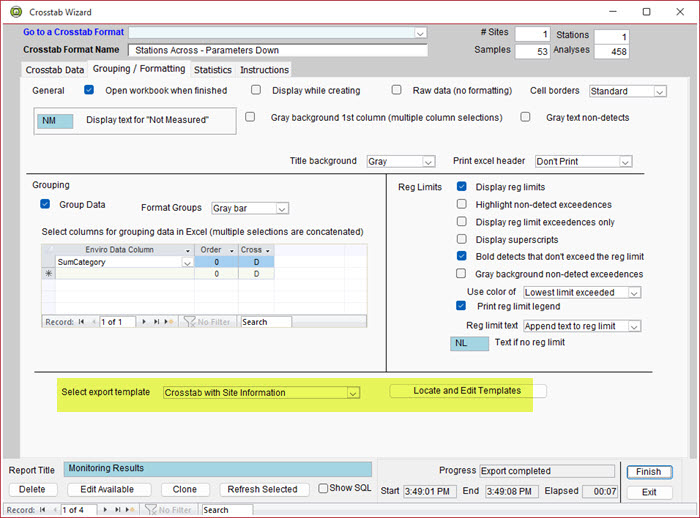
The crosstab templates are saved in the Enviro Data C:\Enviro\EData8\Templates folder. Because each template file contains coded instruction on the format to be created, Geotech strongly recommends that the first time you open one, promptly do a Save As and save it with a different name in the C:\Enviro\EData8\Templates folder and add it to the Datasheet. This way you will have your own copy that can be used to create new custom formats. A several example templates are provided with Enviro Data.
Note: for informatoin on the Version 8D feature adding NL to reg. limits or NM to results please see the FAQ on How can I show in a crosstab that no measurement taken for a sample or that there was no Reg. Limit for a specific parameter?
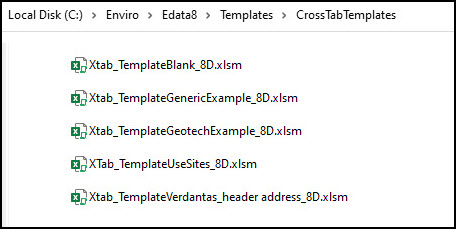
Crosstab templates are saved in the Enviro Data C:\Enviro\EData8\Templates\CrossTabTemplates folder shown below. Because each template file contains coded instruction on the format to be created, Geotech strongly recommends that the first time you open one, promptly do a Save As and save it with a different name in the C:\Enviro\EData8\Templates\CrossTabTemplates folder and add it to the list of available templates as shown below. This way you will have an original copy that can be used to create new custom formats. A several example templates are provided with Enviro Data. Instructions for modifying these templates can be found in the User Documentation.
The Crosstab Templates from is used to select and locate the crosstab templates. You can also add a friendly Description to these files and if needed you can also delete any existing template files that are not needed. Any new template (XLSM) files should be copied into your C:\Enviro\EData8\Templates\CrossTabTemplates folder or a shared location on a server.
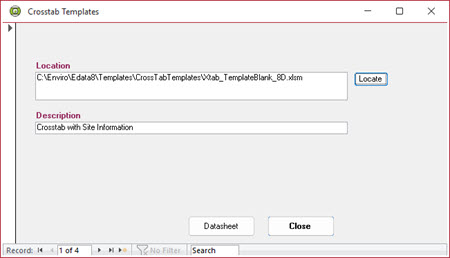
This is the Datasheet form of the Crosstab Templates table.
For more information on creating, editing and using crosstab templates please see the Crosstab Export Template section of the Documentation.
The crosstab report will display up to 12 limits but to display multiple regulatory limits in a crosstab or other report that supports them, you must first setup a regulatory limit group and then add the limits you require to this group. When creating groups, we recommend naming your group in a way you can identify it as a group such as using an “_” (underscore character) in front of the name to differentiate a single limit from a group.
Additionally, you must have checked the Display Reg Limits check box shown below.
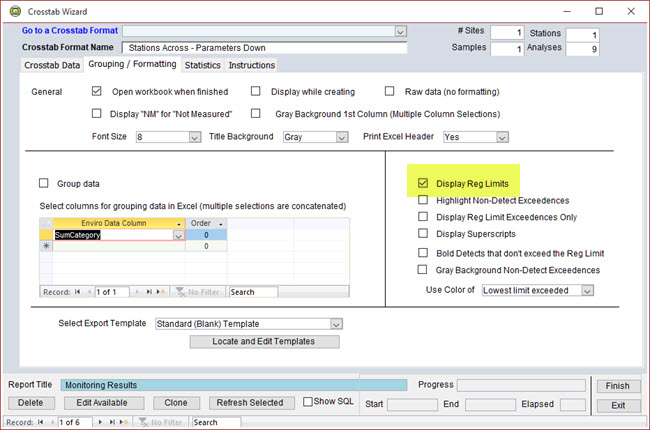
For more information see the FAQ on Why are my regulatory limits not showing up in reports?
General Questions
There are two possible causes for forms to fill the whole page or look weird. Both are generally easy to fix.
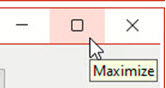
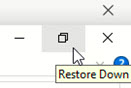
The first case is that the form takes up all of the Access window and is a result of a common error. Itis caused by Maximizing the current window using the control found in the upper right of every Windows window (see figure immediately below). This is most commonly seen when using Print Preview to view an Access Report and then zooming in to enlarge it and then forgetting to Restore [it] Down (shwon in second image below). it. This can happen with any Access form so make sure you Restore after Maximizing!
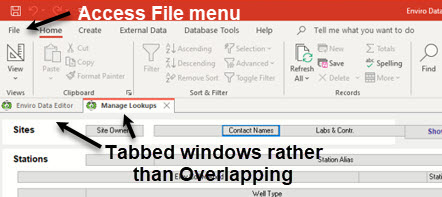
The second case is a little more complicated, but is still easy to fix. Your forms, tables, etc. will show up as Tabs in the Access window. This make the many form look strange and hard to see their data . An example of tabbed Access windows are shown below.
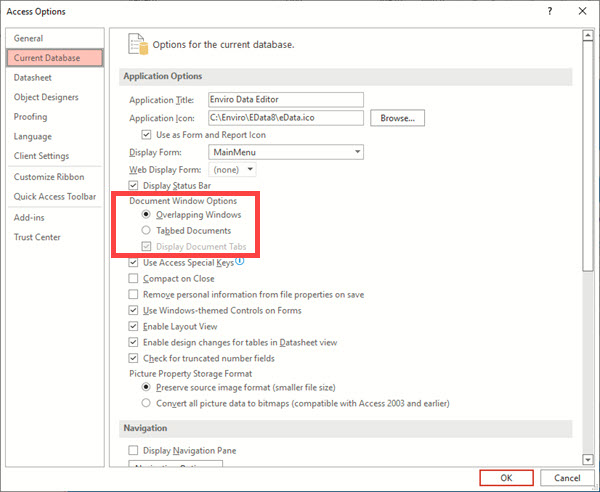
To correct this, on the Access menu in the upper left (shown above) click on File and then on Options at the bottom left. In the Access Options form that opens (shown below), click on Current Database and change the setting for the Document Window Options from Tabbed Documents to Overlapping Windows. Click OK to return to Access.
Note you must Exit all Access programs and restart them to apply this change. You can restart by simply opening Enviro Data.
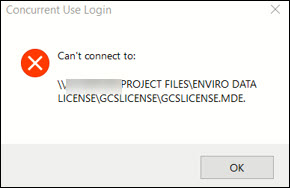
This error occurs with a shared installation where Enviro Data is not seeing your Enviro Data license database on the server. Enviro Data uses a database file named GCSLicense.mde to keep track of how many licenses have been purchased and, how many are currently in use. It should be stored in a location on your server where you have read\write access rights. This error occurs because your computer cannot locate the file because something has changed with your computer or the network path to your server where the license is stored. To correct the error you will need to find the new path to the license database, make some changes, and then connect to it again.
- Make sure both the Editor and Viewer programs are closed.
- Locate the location of the license file.
- In your computer's C:\Enviro/EData8 folder find and delete the file named “eKey.lck”.
- Open the Editor .
- When the SETUP LICENSE form opens, fill in your licesnse key.
- When asked, point this computer to the license file on your server.
If this was a change to your network or server, you will likely need to do this on other computers in your office.
If you cannot locate the license database, or do not know you Enviro Data key code, please contact Support@geotech.com for assistance.
Non-Detected results are common in environmental data and Enviro Data provides a complete set of tools for handling them. Using these allow you to specify exactly how you want the results displayed with options such as < .01, .01u, ND, and so on. By using detection limits along with the other features of Enviro Data, you can even specify a numeric factor or value, such as zero or half the limit, to report for the result, for special situations like contouring, statistics, or risk analysis.
The detection limit and the type of limit is provided by the lab. For example, Detect might be 0.01 and the LimitType could be “RL” and it is not unusual for a lab to provide multiple detection limits. However, the limit’s reporting units (not duplicated in the EDD) must be the same as the analytical value’s units.
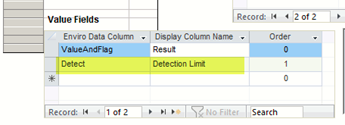
The limits and limit types for each result should be in the electronic data deliverables or EDD file during the importing of data provided by the laboratory. See screenshot below. During the import, they are stored in the Detect and LimitType fields in the Analyses table. Detect is the value of the detection limit and the limit type is the type (usually an abbreviation) of the limit for that specific limit. For example. Detect might be 0.01 and the LimitType could be “RL”. The limit’s reporting units (not duplicated in the EDD) must be the same as the analytical value’s units. You can store up to five detection limits for each result in these paired fields: Detect / LimitType, Detect2 / LimitType2, etc. to Detect5 / LimitType5. The screen shot below is from the DTSFormat8.xlsx import electronic data deliverables (EDD) file showing the fields that the limits are imported from. While there are only three limits available in the DTSFormat8 EDD, you can import up to five (total) with the User-Defined Import.
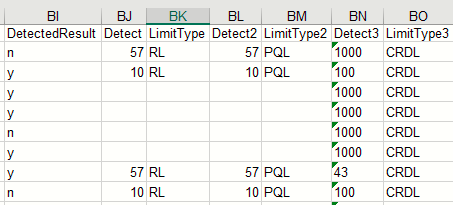
Users have the ability to choose which of the five available columns to use to store their various detection limits. Typically, the “Detect” and “LimitType” columns are used for the RL or PQL limits, and the “Detect2” and “LimitType2” columns are used for the MDLs. There’s no set rule, but obviously if you only have one limit you need to use Detect / LimitType. Also, it’s imperative to be consistent. If the detection limit columns in your databases contain a mixture of different detection limit types, Geotech can help you run a few queries to get each limit type consistently assigned to the desired column.
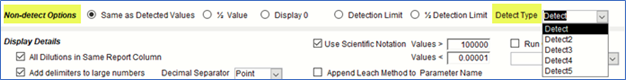
You can select which value you wish to display in the Non-detect Options section of the Display/Graphing Options form as shown below.
You can also select multiple detection limits in the Crosstab Wizard Export.
Most users, however, will choose to display (whichever limit they need) for non-detected results in the Value and Flag field selected in conjunction with the Analytical Flag codes.
Starting with Version 8 B, the calculations routines have been revised to always re-calculate if results have been added to the Analyses table. If results have been edited or re-imported, if a Display Options setting has been changed, or as in the case of some existing data calculated with incorrect units, the re-calculated values are always based on current and correct information.
Additionally, the calculations always use the Parameter Units that are set up for the parameter and matrix, in the Parameters table so make sure parameter units are set up correctly. And, for results with inconsistent units, always set Display Options to perform Unit Conversions.
Before you request support please read ALL of the following,
Have you checked the Documentation for a solution to your problem? the documentation can be downloaded using the Download button in both the Editor and Viewer.
Have you checked the Frequently Asked Questions on our website for a solution to your problem? We have a large set of short articles on the most frequently encountered and asked about issues from our clients.
Note that both the User Documentation and FAQs are updated regularly so check back whenever you have a problem or need more information.
When asking for help, please do not send your request to a specific individual but contact us at support@geotech.com. This way, if a specific individual is not available, everyone can see it and someone else can jump in. Also, even though one person maybe handling your request, another might have a suggestion or solution that could solve it. Also, please use Reply All when responding.
We are here to help you but please, provide us sufficient information to help us understand the issue you are having problems with. This needs to include:
• What version of Enviro Data are you having the problem with? This information can be found on the main menu of both the Editor and Viewer and may be different for each. Examples would be Ver. 8 A 1.73 or Ver. 8B 1.3.
• Is the problem with the Editor or Viewer?
• What specifically are you trying to do? This might include something like: “I was trying to create a Crosstab Export and had selected a Reg. Limit Group, but no Reg. Limits showed up in the export. Or “I was trying to import new records from my lab using the DTS8 format and Excel and I got an error saying _____.”
• Are you not getting any results from your selections?
• What were you expecting the output to look like?
• Did you get an error message(s)? If so, send a screen shot.
• Is this happening on multiple computers?
• Is this a new problem or one that has been occurring for a while?
• Is your Enviro Data database local, on a network or in SQL?
• Are you using a shared Library File for lookups? (If you do not know what this is, you probably do not have one.)
• What version of Microsoft Office are you using and is it 32-bit or 64-bit?
• Screen shots are always helpful. These may be of your Select Data or Display Options forms, any error messages you receive, a copy of any output or anything that might be relevant. You can paste screen shots into your message or attached them to the message in JPG or PNG format. Just make sure they are large enough to be legible.
• Let us know if your issue is urgent or routine.
If you have more than one issue/question, please separate them clearly in your message. Solving an issue efficiently depends primarily on good communication. If you have multiple issues that need to be addressed, please make each clear and separate them in your message. Using numbers or bullets would be best.
Have you already contacted Geotech about this issue? If so, please provide a copy of that response. This should be obvious but Use Reply All when replying to any support message on the same topic so there is a history of what has transpired.
If this had been working last time, please describe anything new that has been changed since it worked.
If you did not knowingly make any changes that you expected to affect the results, please say so. Do not go into great detail; just mention what has changed. If the change might be relevant to the issue, we will ask for more details.
Have you made any changes, hardware or software, including but not limited to?
• Installed Enviro Data on a new computer.
• Upgraded to a new version of Microsoft Office.
• Switched from one version of Enviro Data, including updating either the Editor or Viewer alone, include that information in your message.
• If you are on a network, or using SQL Server, have any changes been made to that setup?
• Has your system crashed recently?
• Are you using a new/different/older database?
Have you had this same problem in the past? If so, what was done to fix it then?
Describe the output you expected and the output you received. People sometimes assume that the desired outcome is obvious. It often isn't, especially to someone who is not in the same room with you. Screen shots are always helpful. It's surprising how often people report that they tried something and "it didn't work", but do not describe what happened. If you expected a specific output or result, but there was none, please state that explicitly. Screen shots are always helpful.
If we ask you any questions, please read them carefully and then respond to each of them. We often add numbered steps or questions to our responses. It is very important to follow and/or answer each question. The relevance of our questions may not be apparent to you, but remember, we know how the program is supposed to work.
If you do not respond to our specific questions, you may delay finding your solution. If we ask you to choose a single data record or group of records and answer one or more questions using it, please do exactly that.
General Comments
Support time is deducted from your prepaid support account however, if we determine if the problem is a bug in the software, it will be fixed at no charge.
In many cases we may ask you to provide us with a subset of your database, your Settings file and/or any import files you are working with. You can find out how to create a subset here. Note all Access database you send must be zipped up in order be allowed into our email system.
If necessary, we will setup an online conference using Microsoft Teams. (This may require that your IT department gives permission for you to do this.) Voice communication can either by using your computer’s microphone and speakers (or a headset) or by a phone call, whichever is most convenient. This way we can see what is happening on your system to get a better idea what the problem is and how to resolve it. If needed, we may also ask for control of your computer to diagnose or fix the issue. There is no cost for this conference. Before the conference begins we recommend that you check out ZDNet's Ten golden rules for newbies and pros, especially if you have not done this before.
With your help, will attempt to address your issue as soon as possible. However, it may be necessary to assign priorities based on our mutual schedules.
If we determine that your issue is a bug or is a new feature that requires a change to the code, this could take additional time to find a solution. New features are generally preformed under a billed project once we agree on a scope of what is needed, and authorization is obtained. If you have any questions, please feel free to contact us.
List applies the selections made the Display Options form to the data selected and then populates the Selected Data table with that formatted data. This formatting includes converting reporting units, providing Value and Flag and other features in the table. Depending on the amount of data selected, this can take time to prepare and display.
Quick List provides a basic listing of the selected data WITHOUT applying any formatting and shows the reporting units as they are stored in the Analyses table without making any unit conversions. Because Quick List does not perform any formatting, it is much faster than List and is valuable for viewing raw data.
For quality assurance and quality control (QA/QC) purposes, environmental projects generate duplicated data in a variety of ways. Care needs to be taken with this duplicated data at both the samples and analyses levels. Enviro Data can handle duplicated data at both the samples and analyses levels. To import this duplicated data, the system uses two fields, DuplicateSample and Superseded, which are numeric fields in the Samples and Analyses tables respectively.
Duplicate Samples.
Duplicate sample are one or more additional samples taken from the same station at the same time to check the quality of the sampling, shipping, and analysis processes. This information is stored in the DuplicateSample field in the Samples table.
At the sample level, this data could be QA/QC data associated with an original sample such as a field duplicate. As an example, an original sample assigned a DuplicateSample number of zero might have a field duplicate taken on the same day, which would be assigned a DuplicateSample number of 1. The QCSampleCode in the Samples table is used to explain the meaning of the two samples, with perhaps a code of “Original” for the first sample, and a code of “Duplicate” for the second. Additional related samples are given higher DuplicateSample numbers. In some cases, the additional sample might be a second original sample instead of a QC sample. In this case, the QCSampleCode might be the same for both samples, however, in most cases the LabSampleID number would be different.
Enviro Data identifies unique samples based on the station, sample date, sample matrix, sample top, duplicate sample, sample bottom, filtered sample, field sample ID, QC sample code and alternate sample ID fields as seen in Figure 134 below. This allows the data administrator to import multiple samples related to one sampling event or make multiple imports of analyses from a given sampling event.
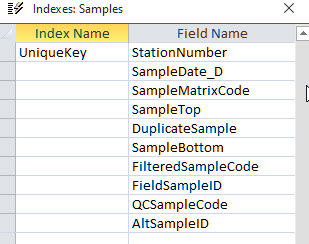
Figure 134 - Fields used to define the Unique Index in the Samples Table
Superseded Analyses
A superseded analysis is a duplicated result from one or more a re-analysis of the same sample for a single or group of parameters for QA/QC purposes. This results in duplicated or superseded results at the analyses level. In the industry these results can be represented in two ways, either as the original result plus the re-analysis, or as a superseded (replaced) original result plus the new unsuperseded result. This information is stored in the Superseded field in the Analyses table.
During import Enviro Data provides a way to supersede the original result value as this is more useful for selection purposes. You can choose to supersede or replace (overwrite) a superseded result by checking or unchecking the Supersede Values If Present checkbox in the IMPORT WIZARD – OPTIONS AFTER CHECKING After Successful Check section. If this box is checked, a new analysis will supersede the old one. Otherwise, if it is unchecked, the new analyses will replace (overwrite) the old one. Either way, in the when selecting data, you can easily choose to see just the most current (unsuperseded) data. Selecting the re-analyzed results is not as helpful because not all the parameters may have been re-analyzed.
Enviro Data identifies unique analyses based on sample number, parameter number, superseded, analytic method, leach method, report units, basis, filtered analyses code, QC analysis code and lab sample id fields as seen below in the figure below. This allows the data administrator to import multiple analyses related to one sample or make multiple imports of analyses from a given sampling event. Re-analyses or analyses delivered at separate times are matched to the correct sample event by the import code using the unique fields listed above.
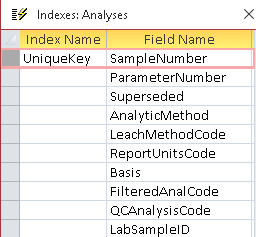
Figure 135 – Fields used to define the Unique Index in the Analyses table.
Discussion of Duplicates and Supersedes
Examples of data at these two levels, and the various fields that can be involved in the duplications at each level, are shown below.
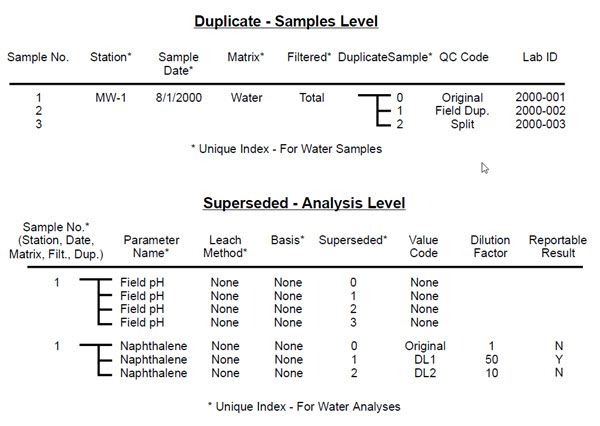
Figure 136 - Diagram of duplicates and supersedes
In the Sample Level example in Figure 136 above, there are three samples from the same well on the same date: an original sample, a field dup, and a split. These are represented with three different DuplicateSample numbers, and three different LabSampleID numbers.
In the Analysis Level there are superseded results for two different reasons.
In the field four different pH values were taken, most likely to confirm that the well chemistry had stabilized prior to taking a sample. The results have increasing superseded values from 0 to 3, with the 0 value being the most recent and presumably most representative value.
For naphthalene, multiple results were reported possibly due to matrix interference. The dilution factor for each result is shown. The original sample is reported with a superseded of zero, and the dilutions with higher superseded values. The ReportableResult field has been used to override which result will be reported. An alternative would have been for the data administrator to adjust the superseded values so the value for the result at a 50:1 dilution had a superseded value of 0 and it would be displayed by selecting a superseded value of 0 on the SELECT DATA form.
At the analyses level, the Superseded field is incremented when different analyses apply to the same sample and parameter. For example, multiple dilution analyses can be stored with incremented superseded values of 0, 1, 2, etc. Likewise, a re-analysis can be stored with a superseded value of zero (most recent data), while the original value remains in the database with a superseded value of 1. Note that this use of superseded values is the opposite of the more traditional view of new data for the same parameter as being a “re-analysis.” Experience has shown that while both the superseded and re-analysis view of the data validly describe what happened, the superseded approach is more useful for selecting data, since you can select the “unsuperseded” data (Superseded = 0) to suppress all but the most representative data. This is the default on the SELECT DATA form in the VIEWER program, so for the most part people get what they expect without much effort.
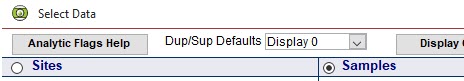
While you can manually change or delete the values in the Duplicate or Superseded Field Criteria boxes in the Select Data form, this form now had a dropdown control that will toggle them between a value of 0 (zero) and nothing (Null). This control can be found near the left side the Action Buttons Bar. “Display 0” is the default setting and how Enviro Data has historically opened the Select Data form. Caution: This should only be used to show the specific duplicated and/or superseded information when outputting data for calculations, exports, and reports.
The default is to leave this control set to “Display 0”. This means that both the Duplicated or Superseded Fields Criteria boxes will contain a 0 and duplicated or superseded data will NOT be provided in the dataset. If this control is changed to “Nothing”, the default of 0 is removed from both the Duplicate and the Superseded Fields Criteria boxes. The resulting dataset WILL contain every duplicated sample and every superseded result.
The ValueCode field provides a reason for the superseded value, such as re-analyzed, dilution, etc. however, the ValueCode field is not used to order the superseded sequence. The software sets Superseded values if one of the Duplicates and Supersededs options on the IMPORT WIZARD form, shown below, is selected as described in Duplicates and Supersedes in the User Documentation.
![]()
Figure 137 - Duplicates & Superseded settings in IMPORT WIZARD form
Correctly assigning QCSampleCode is crucial to identifying original vs. QC data as the QCSampleCode field is used to correctly identify original data vs. QC data for reporting. If you are importing data with QC sample information, you must populate the DuplicateOrder field in the QCCodes lookup table before importing as the Import Wizard uses this field to set your duplicate values based on the duplicate order.
Understanding duplicate and superseded values is very important for understanding QC and other data in Enviro Data. Selecting data based on duplicated and superseded values is discussed in Select Data section of the documentation.
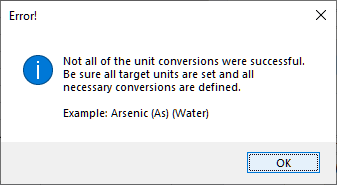
This error generally occurs because the Parameter Units field has not been set for the parameter and matrix shown in the error message. However, it can also be displayed when you list / report Surrogate and regular analyses which have different matrices.
Enviro Data only displays this error message for the first Parameter Units error even if there are additional one that need attention. The parameters with errors are indexed in alphabetical order. In the case above with Arsenic, there would likely be more errors to correct. If this error was for Zinc, you might not expect any more. Additionally, since some routines in Enviro Data may loop through the data more than once to produce the output required so you could see the same message again before it finishes processing.
Parameters Units are used by Enviro Data for comparison for both regulatory limits and the unit conversion feature. You can associate one reporting unit (or Parameter Units) for each combination of a parameter and matrix. Unit conversion converts any units to the matching select units set in the Parameter Units. For use with Regulatory Limits, the Parameter Units and the matrix must be the same as the units (and matrix) of the limits you are checking against.
Target units can be set in the Parameter lookup table and conversion can be set in Unit Conversion lookup table, both found on the MANAGE LOOKUPS form. You can find more information on this issue in the FAQ at What are parameter units and why do I need to set them?
There are multiple reasons why trailing zeros are lost and/or decimals places are not displayed correctly. Options for decimal places can be found in the EDD that is imported, the import setting and in Display Options when the data is reported or exported. (See screen shots below.)
1. Our standard EDD has a NumberDecimals field that the laboratory can populate when importing data. If this field is used, Enviro Data stores that information in that field in the Analyses table for use when the result is displayed.
2. If the NumberDecimals field in the EDD is not populated Enviro Data calculates the number of decimals from the Value field and stores that number. If this is the case, you can choose to use the decimal places from either the Value or the Detect field in the EDD.
Options for # of Decimals in the Import Wizard in the Editor
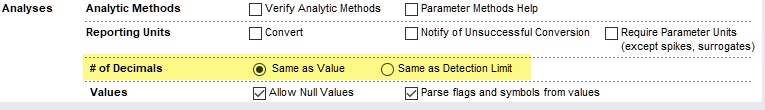
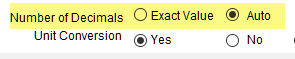
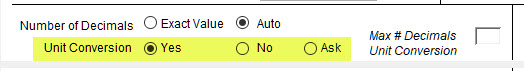
3. When preparing reports or exporting data, there is the Number of Decimals option in Display/Graphing Options that can determine how the decimal place to be displayed. The options are Exact Value or Auto. Setting this option to Auto will use the NumberOfDecimals value stored in the Analyses table to add back trailing zeros if necessary. Choosing Exact Value turns this feature off and uses the Value field as it is stored The Auto option is necessary because Microsoft Access (and Excel for that matter) do not normally store or display trailing zeros. Loss of these zeros can be a problem because they contain information about the precision with which the result was measured.
Options for Number of Decimals in the Display/Graphing Options form in the Viewer
4. Once you have the correct decimals places stored and output, the Viewer outputs the Value of an analysis with the correct decimal places based on the option chosen.
Your results will vary depending on the output chosen. For the Crosstab Export, Value and Flag is always stored as text and this is recommended. However, the Value (only) field is numeric. If you are depending on the Value field only, this can be problematic because Excel does not store or display trailing zeros in a numeric field.
Note that if you are having a problem with decimal places and/or significant figures, you should check with Support to see if there is a newer version available. Also, the screen shots shown above may vary slightly depending on your version of Enviro Data.
Trailing zeros are NOT supported in regulatory limits as they are meaningless.
Note that most of this section also applies to Validation Flags that use a similar form and table structure.
Flag Codes are not required and generally are not checked to see if they present are in the Analytic Flags or ValidationFlags tables and Flags not in the Analytic Flags table may be ignored in ValueAndFlag formatting. Flags used in the Analyses.FlagCode field that are not in the Analytic Flags table can cause a problem when moving to a newer version of Enviro Data. This means you need to be extra careful when using them.
Analytical Flag Codes
A FlagCode is an analytical flag that describes the analysis.
It is important to understand that in Enviro Data there are two similar but different FlagCode fields, one in the AnalyticFlags lookup table and a different but similar one in the Analyses data table. The FlagCode field in the Analyses table contains one or more FlagCodes from the AnalyticFlags table. When multiple codes are used in the Analyses table, they must be separated by either a comma or a space.
AnalyticFlag in the Lookup Table
The FlagCode in AnalyticFlags table is a lookup that stores a single code of up to four characters and cannot contain any spaces or commas. The AnalyticFlags table stores the following:
• FlagCode is the code for a ONE Analytic Flag. It can contain multiple characters but cannot contain a space or comma.
• AnalyticFlag is description of the code.
• ReportingFactor is used as a multiplier for statistical analysis. Note that this can be impacted by selections in Non-Detect Options on the DISPLAY OPTIONS form.
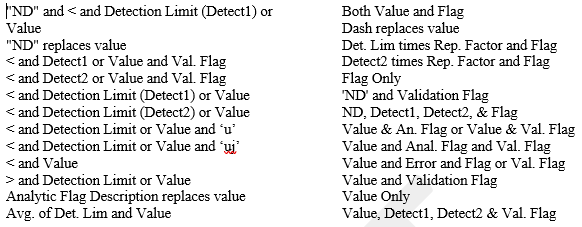
• ReportingBasis indicates how display the output. See examples in Reporting Basis.
NOTE: Use Analytic Flags Table must be selected in the Detected Value Options and Same as Detected Values in the Non-detect Option on the Display/Graphing Options form as shown below for the Value and Flag field to be displayed in the ReportingBasis format in Reports or Exports.

Fig. 18 - Settings for Detected Value and Non-detect Options in Display/Graphing Options form.
• ReportingPriority determines the flag’s priority in formatting the value for output. The flag with the lowest number will determine the format. Note that ReportingPriority is an integer and only accepts whole numbers. See examples of this in Figure 21 and Figure 22.
Note the field Indicate Non-Detect was replaced by the DetectedResult field in the Analyses table after Version 2012.
To view the flag codes, open the ANALYTIC FLAGS form. This can be done either from the Edit Analytic Flags button on the Display Options form in the Viewer (shown on the screen shot above) or from Manage Lookups Analytic Flags button in the Editor. This form can be seen in Figure 19.
You can scroll through the Flag Codes by using the page control at the bottom left. You select how each Flag Codes displays using the ReportingFactor, Reporting Basis, and/or ReportingPriority options. (Note: Setting a flag as a detected or non-detected is no longer an option on this form. Use the DetectedResult field instead.)
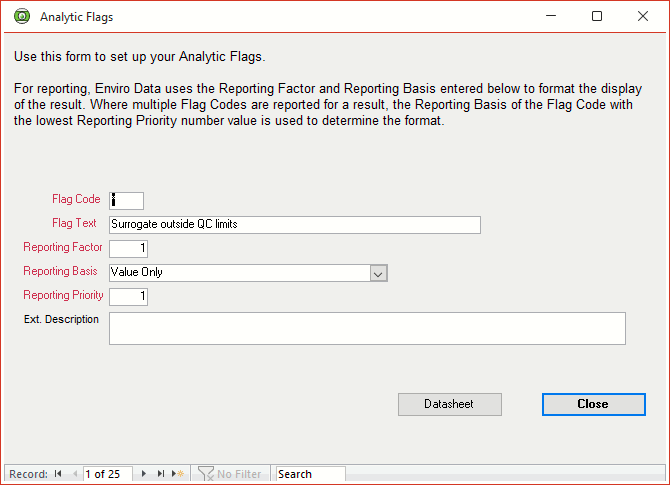
Fig.19 - ANALYTIC FLAGS form in Form View
This table can also be edited in Datasheet View as shown in Figure 20, below, by clicking the Datasheet button.
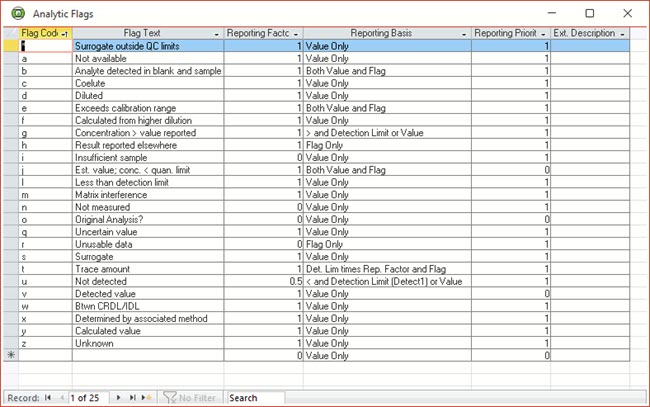
Fig. 20 - ANALYTIC FLAGS form in Datasheet View
Note that the FlagCode or “Y”, and its description AnalyticFlag of “Calculate Value” is a required value because it is used in some calculations. Even if you are not doing any calculations, if this flag is not present, the ValueAndFlag field may not be displayed correctly.
Examples for Reporting Basis
FlagCode in the Analyses Table
The FlagCode in the Analyses data table can contain one of more analytic flags that are separated by spaces or commas. These are usually imported with your analytic results. They are not checked against the AnalyticFlag lookup table during an import.
• The order of the flags doesn’t matter, when being output to a report or export the program is only looking for the lowest ReportingPriority.
• You can have any number and combination of FlagCodes, up to the 25-character limit in the Analyses table.
• Commas or spaces always indicate that multiple FlagCodes are present.
• If the analysis is considered a usable value, and would not otherwise have a qualifier, this field can contain the code for Detected Value (usually a “v”).
• If the analytical flag is unknown, it may contain a “z” but this not required.
• The FlagCode field may be left blank if desired.
Example of Flag Code Usage
One example is if data is imported with FlagCode “U,B” which should indicatesa that the result is a not-detect and there was a problem with a blank. Because of the comma, these are two distinct qualifiers (flag codes). The AnalyticFlags table should have two records: one with FlagCode = “B”, and another record with FlagCode = “U”. It should NOT have a record for FlagCode = “U,B”. (Ignore all quote marks.)
Controlling How Data is Displayed
The formatting decisions that you make as described in this section are used for most types of output, so you should see the same result whether you are printing a report, exporting to Excel, or posting the data on a GIS map.
For reporting, Enviro Data uses the Reporting Factor and Reporting Basis entered below to format the display of the result. Where multiple Flag Codes are reported for a result, the Reporting Basis of the Flag Code with the lowest Reporting Priority is used to determine the format.
Here’s what happens when Enviro Data formats ValueAndFlag in SelectedData during an export.
1. The Value and Flag handling parses FlagCode from the SelectedData table (retrieved from Analyses) into its two separate flags (“B” and “U”) and sorts them by first ReportingPriority assigned to the code in the AnalyticFlags table, then alphabetically. If a code is not found in the AnalyticFlags table, that code is ignored.
2. The flag with the lowest ReportingPriority wins, and its ReportingBasis is used to format the result.
3. If both FlagCodes in the AnalyticFlag table have the same ReportingPriority, the code that appears first in the alphabet wins.
For example, you could display your non-detects with a "<" sign and the detection limit. Or you could display them as "ND" or " - ". But for results with a "J" flag, you could display the value followed by the flag. See examples in Table 1.
Note: The FlagCode “v” for “no code required” is generally automatically stripped out of exports and reports.
The Value and Flag function uses the Reporting Basis shown below in Table 1 for each character of the analysis FlagCode. It also finds the Reporting Factor from the AnalyticFlags table based on the first character of the analysis FlagCode. This factor is used to calculate the number displayed for non-detects, if that option is selected on the DISPLAY OPTIONS form.
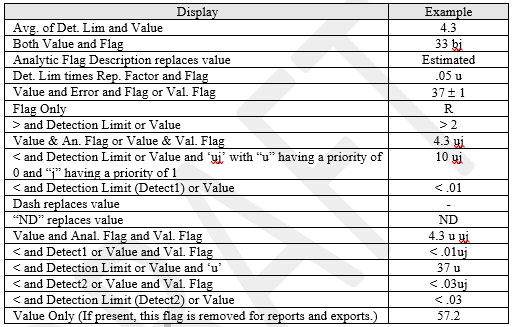
Table 1- Examples of Value and Flag Formats
If there are multiple flags, i.e. b j, and you wish to print j in reports, use the Reporting Priority on the ANALYTIC FLAGS form to set the hierarchy determining which flag is used in the display. Again, if two or more flags are encountered, the flag having lowest Reporting Priority value is used. If two or more flags have the same Reporting Priority, then the priority is determined alphabetically.
An example of this is a analytical result with the FlagCode of “u,d” for undetected and diluted respectively. If the ReportingBasis for the “u” was “< and Detection Limit (Detect1) or Value” you would expect the Value and Flag field to be something like “< 0.06”.
However, if both have a ReportingPriority value of 1 in the AnalyticalFlag table, then the program would use the ReportingBasis of the “d” flag which does not contain a “<” so the results would not be formatted as a non-detect. See the examples in Figure 21 and Figure 22 below. 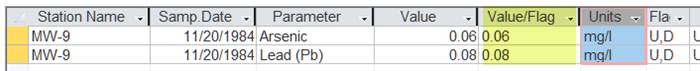
Fig. 21 - Value/Flag format where Reporting Priority for flag codes "u" and "d" are the same.
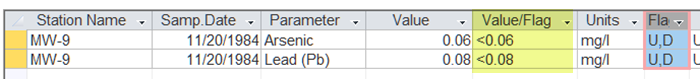
Fig. 22 - Value/Flag format where Reporting Priority of flag code "u" is 0 and for "d" is 1.
Note: If the Value/Flag is not displaying correctly after checking all of the above, check Parameter Units to see if it is set correctly for the parameter(s) in question.
There are over eighty lookup tables in Enviro Data that contain lists of "lookups" or valid values. Lookups, common to a relational database, can be used for parameter names, flags, units, etc. As such, they help interpret the data in the primary tables, and enforce data quality. Because they often change from project to project, they can be managed separately in each project database if needed. This makes it easy to customize a database for your specific project needs. Enviro Data gives you complete control of these lookup tables and you can customize them to suit the needs of each of your projects. Note that the lookups that come with Enviro Data should be considered suggestions.
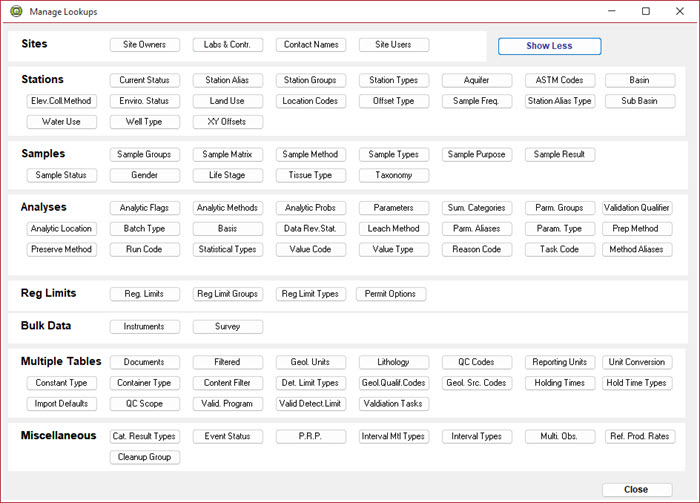
Lookups can be edited using Manage Lookups form in the EDITOR shown below.
Parameter Units are used by Enviro Data for comparison to regulatory limits and also the unit conversion feature. (Unit conversion allows you to determine the target units for a conversion during import or reporting.) You can associate one reporting unit or Parameter Unit for each combination of a parameter and matrix.
For use with Regulatory Limits, the Parameter Units (and the matrix) must be the same as the units (and matrix) of the limits you are checking against.
They are also used during import checking, the Validation module, and in some reports.
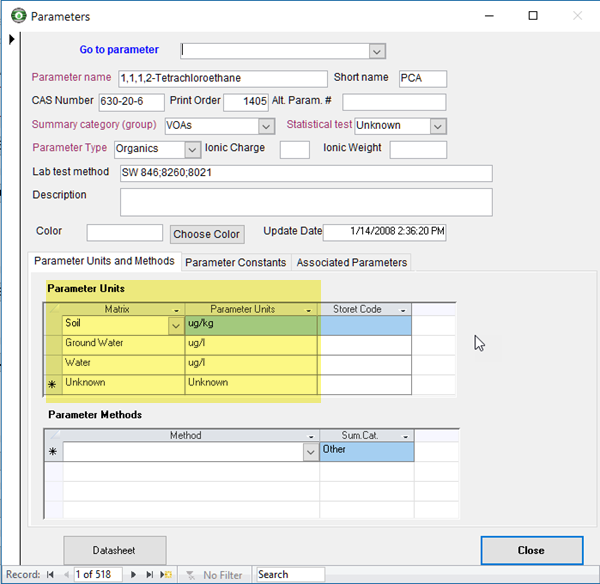
You can view and edit Parameter Units by going to the EDITOR's Setup section, clicking on Manage Lookups and then clicking on Parameters. This will open the PARAMETERS form seen below. You can select the parameter desired in the Go to Parameter dropdown. Both the Matrix and Parameter Units can be set by using dropdowns in the appropriate text box. Note that both the Matrix and Units chosen must be present in their appropriate lookup table.
In order to have these work with your data, make sure you also set Unit Conversion in the Display Options form as shown below.
When you get a notice that no records were return when selecting data this usually means that the selection criteria you have entered on the SELECT DATA form did not result in any data being retrieved. On this form click on the Update button and see if there are records shown in the box next to it. If not, try changing the selection criteria.
The Map tool used a 32-bit add-on to create the mapping feature. It is still available iin current versions of Enviro Data but only when installed with 32-bit Office. Geotech is looking for a substitute that will supports both 32 and 64-bit Office.
The Map feature allows you to display simple dot maps in Enviro Data without needing a separate mapping program. You will need a vector base map (such as a CAD drawing or a ShapeFile) and optionally a bitmap image. These should be entered on the Sites form for each site for which you want to make a map. You will also need coordinates in the Stations table that match those of the base map. Then select data for one parameter, click on Map at the bottom, answer the questions on the next two forms, and your map will be displayed. Additionally, to use a shapefile as the base map, export the shapefile to AutoCAD Release 14 format and use the resulting CAD file as the base map.
There are multiple ways to store geologic data in Enviro Data.
You can assign geology and lithology to each physical sample in the Samples table. This makes it easy to tie the geology to field and lab data.
You can also select a geologic unit for each station in the Stations table. This is generally used for the formation at the bottom of the hole for soil and similar borings, or the geologic unit of the screened interval for water wells.
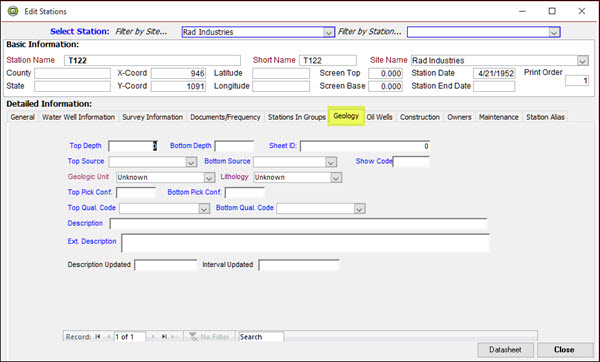
Finally, in the Stations table you can store formation “tops” by location and independent from the samples. This probably better represents the actual site geology and allows you to enter the geologic column encountered at a Station location by depths. This could be (and often is) different from the geology of the samples and may be referred to as the site stratigraphy. You can do this in the form below from the EDITOR; click on Stations and then on the Geology tab as shown below.
There are many ways to view or list data in Enviro Data. The Select Data form in the VIewer provides a Quick List, List, Report, Export and Graph buttons that produce a variety of output. In the Editor, you can list Sites, Stations, Samples and Analyses using these buttons and the Datasheet button. Additionally, Manage Lookups in the Editor provides a way to edit and view many of the lookup or valid values tables again using the Datasheet button on each of the forms.
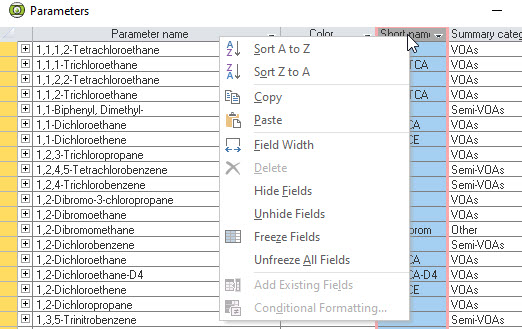
Most of these lists, regardless of where they are found, can be modified by either right-clicking in any field header and changing the options or, by selecting one or more columns and dragging to change their order in the header. The screen shot below from Manage Lookups --> Parameters --> Datasheet shows the options available in lists.
Please see the video instruction for the Enviro Data Lab Master Services Agreement Tool on our YouTube channel.
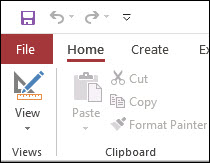
1. At the top left-hand corner click on File in the Access file menu.
2. Click on Options to open the Access Options form.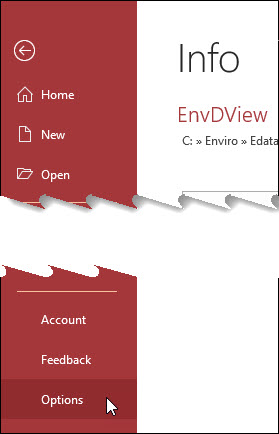
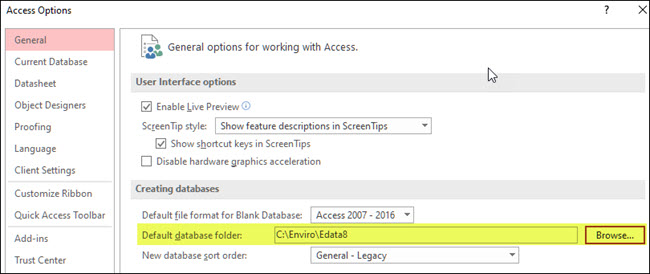
3. Make sure General is selected in the top left of the Access Options form. (See below)
4. Under Creating databases section, the Default database folder, click the browse and choose the folder you wish Enviro Data to open in.
5. Click OK to return to Enviro Data. You may have to restart Access for this to take effect.
In most you should select the folder C:\Enviro\EData8 because you will need to access multiple folders in this one. However, you could also set it to C:\Enviro\EData8\Databases for attaching a database or C:\Enviro\EData8\Import or C:\Enviro\EData8\Export depending on your needs.
It may be necessary for Geotech Support to have a sample, or subset, of your database in order to determine the issues you are encountering. A subset is a portion of your database in an Access (MDB) format from the Select Data query you used that replicates the issue.
Creating a subset of your database is very easy. Use the Select Data and select the data set used when you encountered the problem.
Many times, a problem with Enviro Data can be traced to a problem with the computer itself. Below are some of the solutions to try when something does not seem right with your computer. While these may not solve your problem, they will not harm your computer. They only take a few minutes to run and rely on tools built into Office and Windows. We recommend you run them in the order shown. While these steps apply to all versions of Windows, the terminology may vary slightly from one version to another.
Note that we are assuming you are running an up-to-date antivirus and/or antimalware application.
If you are having a specific problem with Enviro Data, try these steps first.
- Restarting usually solves most issues. Before restarting, make sure you have saved any settings or files you need. Note we are not talking about turning your computer's power off.
- Click on Maintain Database and then click Clear Temporary Tables.
- Close Enviro Data and then and open the database file you were attached to in Access then run "Compact and Repair*. This should only take a few minutes. Note that this step does not apply to databases on SQL Server.
- Open both the EDITOR and VIEWER programs and run Compact and Repair in each from Access’ Database Tools menu.
- Check to see if you are still having the problem. If so, continue below.
- Check your hard drive to see how much free space you have available. It is recommended to have at least 10% free space. You can check this by opening the Windows Explorer in My Computer view (this will vary depending on the Windows version) and check to see how much space you have free on your hard drive(s). If you see a red bar, you need to move or delete some files to free up space. (If you cannot delete or move any files you may need to get a larger drive.) To help free up space run the Windows Disk Cleanup (CTRL-R and type in disk cleanup).
- While still in Windows Explorer, right click on the C:\ drive and choose Properties then use the following steps. Click on the Tools tab. Click on Error checking and then click the Check button. You may see a warning; "You don’t need to scan this drive.” Do it anyway. This may only take a few minutes unless there are serious errors on your drive. (Repeat this for other drives as appropriate.)
We typically do not recommend reinstalling Enviro Data unless directed to by our Support staff.
If you are still having problems with Enviro Data after going through the above steps, send our Support section message and we will setup a Teams meetngto assist you.
* See Compact and Repair a database at Microsoft.com
The answer is yes but this can depend on what computer and network you are running Enviro Data on. Also, the speed of this connection will depend on the speed and latency of your connection.
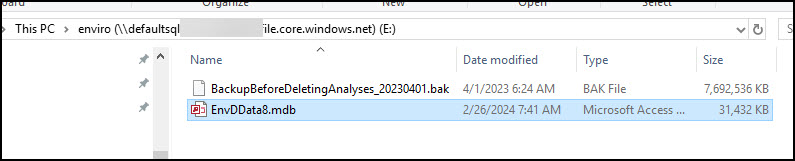
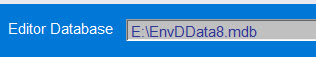
Mounting an Azure File Share involves running a PowerShell script (In Admin mode) on the computer you need to connect from. See How to mount an Azure Files share in Windows | Azure Tips and Tricks (youtube.com). This will create a local drive from which you can Attach to an Enviro Data database. See screen shots below from our Windows Server VM on Azure where Drive E has been mapped to Azure Blog File Share “Enviro”.
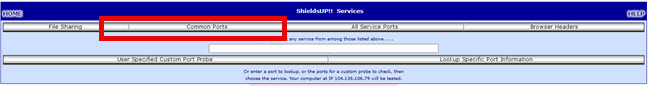
However, for this to work Port 445 on your network will have to be open. While I did this successfully on our Windows Server running on an Azure VM, I am not able to connect from my local Windows 11 Pro computer from home because Port 445 is either blocked by my router or ISP. You can check this in advance by running a free utility called Shields Up at GRC | ShieldsUP! — Internet Vulnerability Profiling. On that page click on Common Ports within the large blue graphic to run it then scroll down to check to see if Port 445 is open or closed (Stealth).
If your network or ISP has Port 445 blocked, Azure provides links to instructions on how to work around this issue located immediately below the windows where you found the PowerShell script. They generally involve a VPN and may involve a monthly fee from Microsoft or others.
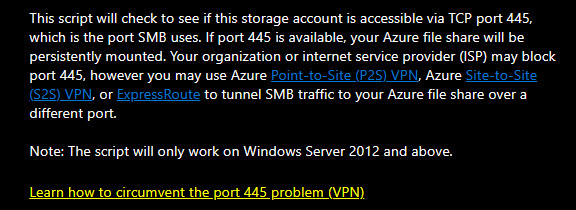
Note that if Port 445 is blocked on your router, you may be able to redirect or unblock it. You would need to contact the router manufacturer to determine how to do that.
There are several symbols used in the MS Access system (that Enviro Data is written in) that should not be used in your data. The use of these may cause errors because Access may treat them as actions or code to be acted on and can also cause problems with file names and paths. These symbols include:
. (period) This is OK when used as a decimal point but might cause problems elsewhere.
, (comma) This is generally not a problem but it depends on where it is. It can cause a problem in Site Name.
/ (forward slash)
\ (forward slash)
* (asterisk)
; (Semicolon)
: (colon)
! (exclamation point)
# (number, pound or hash tag)
& (ampersand)
- (dash) When used in numbers might result in subtraction. OK in site or stations names and other text.
? (question mark)
" (double quote or inches symbol)
' (single quote or foot symbol)
$ (dollar sign)
% (percent) This is acceptable for a reporting unit but within other data fields it is best spelled out.
There are two possible causes for forms to fill the whole page or look weird. Both are generally easy to fix.
The first case is that the form takes up all of the Access window and is a result of a common error. Itis caused by Maximizing the current window using the control found in the upper right of every Windows window (see figure immediately below). This is most commonly seen when using Print Preview to view an Access Report and then zooming in to enlarge it and then forgetting to Restore [it] Down (shwon in second image below). it. This can happen with any Access form so make sure you Restore after Maximizing!
The second case is a little more complicated, but is still easy to fix. Your forms, tables, etc. will show up as Tabs in the Access window. This make the many form look strange and hard to see their data . An example of tabbed Access windows are shown below.
To correct this, on the Access menu in the upper left (shown above) click on File and then on Options at the bottom left. In the Access Options form that opens (shown below), click on Current Database and change the setting for the Document Window Options from Tabbed Documents to Overlapping Windows. Click OK to return to Access.
Note you must Exit all Access programs and restart them to apply this change. You can restart by simply opening Enviro Data.
Importing Data
On occasion, an import file will not import either producing an error, showing many duplicate / superseded results, or having some other problem. Sometimes these issues can be hard to track down. The most common issues are "Import Problem" errors/problems, bad dates, missing lookup data, and occasionally a corrupted Excel file.
If you get to the EDIT IMPORT FILE form and see errors of problems in the Import Problems form see the FAQ on How does Enviro Data use Analytical Flag Codes?
The rest of this section will provide a few steps that might help identify and eliminate other types of problems.
If the EDD is not in the correct format, you may see the error message below. There are many available import formats so first and foremost, make sure you have selected the appropriate format in the File Type and Format box on the IMPORT WIZARD form that matches your lab's file. While Version 8 will import an EDD in the DTS2012 format, you still have to select that format.
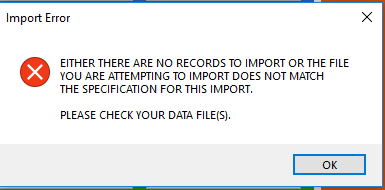
When the import file does not precisely match one of the supplied formats, you may be able to use one of the two User-Defined formats might do the job. These are Columnar and Crosstab. The former can be an Excel or delimited file while the latter is an Excel file.
We recommend that an Excel EDD file only contain a single worksheet unless multiple worksheets are specifically supported for the chosen import format. If the file you are attempting to import has multiple worksheets and/or the first worksheet in that file is not in a recognized import format you can see the error below.
Setting up your EDD file in order to check it for problems
If your file is in one of the supported formats but you are still having problems, you can use the steps below to organize the EDD in Excel to help identify the problem(s).
Since most of these steps require some knowledge of Excel, we have prepared a 5:30 min YouTube video. troubleshooting_edd_setup.mp4, to assist you in performing the steps below. (Note that the video does not follow the exact steps sone. Also, when recording the video, each time the video was paused, Excel lost focus and we had to re-select the entire sheet.) If you are familiar with Excel, you likely can skip the video.
- Open the DTS Import file that you are checking in Excel.
- Make a note of the bottom-right or last cell in this spreadsheet. This would be the bottom row number and the far-right column number.
- Click inside the spreadsheet and using the keyboard press the CTRL and Home keys together to place the cursor in cell A1.
- Now press CTRL and END keys together. This should take you to the cell identified in Step 2 above. If it does not, the spreadsheet needs to be fixed to remove these "extra empty" data cells before importing. These cells could be extra rows and/or extra columns.
- Insert a blank row into row 1.
- Open the import example file for the import format being used. This might be C:\Enviro\Edata8\DTSFormat2012.xls or C:\Enviro\Edata8\DTSFormat8.xlsx depending on your import format.
- Highlight the top row with the field header names in the example file and Copy it.
- Back in your import file, in the blank top row you created above, Paste the example DTS header you just copied.
- This will give you two rows of headers, a correct set in Row 1 and the original ones in Row 2.
- Click in the upper left-hand corner of the spreadsheet to select all records.
- All records must be selected for the following steps through 14 to complete correctly.
- Right click in any cell and select Format Cells then in the Alignment tab make sure Wrap text is not checked.
- Right click in any one of the columns (A, B, C, etc.) and choose Unhide so all columns are displayed. (If all records are not still selected go to step 8.)
- Right click in any one of the rows (1, 2, 3, etc.) to display any hidden rows. (If all records are not still selected go to step 8.)
- Change the font and font size to something easy to read. We personally like Calibri 11 or 12.
- Turn on Filter. (All columns should now show a Filter dropdown.)
- Double click one of the dividing lines in the header between columns to resize each column so all contents are displayed (without text wrapping)
- Compare EACH columns header in Row 1 to the original header in Row 2 and correct any errors.
- Note, if you have selected the wrong example format header or, your import format is non-standard, you will need to take extra steps to resolve this.
- Check to make sure each required field identified by RED font is populated.
- Using Filtering and Sorting to compare the data in the file to make sure it matches the required format.
- If all the header names are present and correct, but they are not in the correct order or you are missing some, you may have to use the User-Defined format.
Correct Headers - If the header row has incorrect fields due to spelling, you really should contact your lab to have them supply the EDD in the correct format. However, if you need the file imported in a hurry, the User-Defined Columnar Excel/CSV import will allow you to map the incorrect fields to ignore the order and/or misspellings.
Formatting of Columns -All the data in each column must be the same data type. You can check this by highlighting a column and right-clicking in the header cell and choosing Format Cells. This will tell you what the data type is for that column. If the column should be Date, that should be the format shown. If not, you may need to change the format. You can sometimes see a formatting problem simply by looking at the data in the column. For example, if there are mixed number and text values, you will see this by the justification of the content. See the example below.
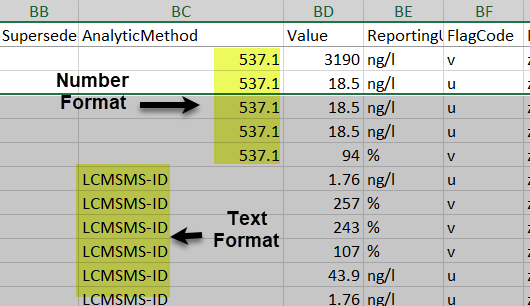
To correct this error, highlight the entire AnalyticMethod column then right-click the AnalyticMethod column and select Format Cells. On the Number tab of the Format Cells form change the Category from “Number” to “Text”, and then click OK and make sure you save your file.
Special Characters - Some characters or symbols can cause problems when used in your data. The issue is that Access may treat them a reserved program code. The primary character that causes problems is the single quote symbol that can also represent a foot symbol, but there are others. See the FAQ Are there any characters or symbols that will cause problems if I use them in my data?
Dates – Date fields require special attention because Access can be problematic when importing dates from Excel. Dates in incorrect formats need to be corrected prior to import. This can be done with your import file in Excel. First click once above the SampleDate_D (or other date field) header to select the entire column. Next, right-clicking on one of the dates and choose Format Cells. In the Format Cells form you can then select Date in the Category window and the type of date in the Type window.
Null (Blank) Dates -- All normal samples should contain the sample date in the SampleDate_D field. Many times, the lab will not include a Sample Date for lab QC samples. There are two ways to work around this. If the sample in questions is truly a lab QC sample just check the Allow Null Dates (shown below) in the Samples section of the Import Wizard - Data Checking Options form, The other way is to copy one of the lab dates (LabRecvDate_D or AnalDate_D) into the SampleDate_D field.

Filtering – You can use Excel's Filter function to see what data is in each column and also filter and/or sort it. To set up filtering, click in the upper left-hand portion of the spreadsheet (above the 1 for rows and to the left of A for columns) to select all cells in the worksheet. Next, on the Home ribbon, click on Sort & Filter and choose Filter. By applying filters to each column missing or incorrect data can be identified. Once a column is filtered, use the dropdown arrow in the column you wish to exam to view the contents. If Blanks are shown, uncheck Select All and then check blanks to see if data is missing, or if this is just an empty row of data.
Sorting – Once a Filter is set, you can sort the columns individually, both in ascending and descending order, by clicking on the drop down at the top-right of each column. By sorting, you can verify that the data range is accurate, there are no alphabetic characters in date or numeric field and that all (required) fields are populated correctly. Blanks should also come to the top when a column is sorted in ascending order.
Duplicate / Superseded issues - We recommend checking to see if the FieldSampleID, the LabSampleID or AltSampleID fields are populated. If they are, choose the most appropriate one of those other fields in the first Import Wizard form for instead of using Auto.
Glitches in the File – At times, there can be a problem in the data that cannot be seen visually. These are usually caused by some data corruption in the file. Saving the file in a comma delimited CSV format and importing it in that format may correct these glitches.
Copying to Another File – As a last resort, you can copy the data into a new spreadsheet, taking care to only select the cell range that only contain your results.
User-Defined Import - Many times an import file may have missing fields in the header, or one or more field names is spelled wrong. When this happens, you can use the User-Defined import with either an Excel or CSV file.
If you are unable to import your file after going through the above checks, Geotech Support can assist you in resolving the import issue(s).
To use as an example to answer this question, a client asked: We report multiple different units and filtered analysis…e.g. the analysis is Chlorophyll, the filter is lab 0.22, the units are mg/L and then for the same station I also have a field 0.45 and units are mg/L for reporting OrthoP for the same station. How is that handled in Enviro Data.
In this scenario, a sample taken at a site and filtered in the field with a 0.45u filter, all these analyses would have the FilteredSampleCode of F45U. When the lab reports Chlorophyll back they would use a FilteredAnalysisCode of L22U (for Lab 0.22u). The OrthoP result would have its own FilteredAnalysisCode of TOT. The units for both would be whatever the lab reports. (See Filtered table below.) However, if the OrthoP sample was not filtered, it would be a different sample even though it was filtered in the lab. They obviously would not be the same Analysis since the Parameter is different.
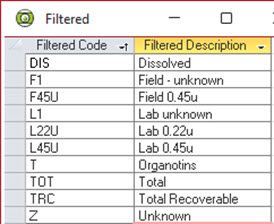
Filtered lookup table.
Also, if these two samples did not all have the same criteria as shown in the unique index for the Samples, they would not be the same sample.
Criteria for a Unique Sample
Enviro Data identifies unique samples based on the station, sample date, sample matrix, sample top, duplicate sample, sample bottom, filtered sample, field sample ID, QC sample code and alternate sample ID fields as seen below. This allows the data administrator to import multiple samples related to one sampling event or make multiple imports of analyses from a given sampling event.

Fields used to define the Unique Index in the Samples Table.
Criteria for a Unique Analyses
Enviro Data identifies unique analyses based on sample number, parameter number, superseded, analytic method, leach method, report units, basis, filtered analyses code, QC analysis code and lab sample id fields as seen below. This allows the data administrator to import multiple analyses related to one sample or make multiple imports of analyses from a given sampling event. Re-analyses or analyses delivered at separate times are matched to the correct sample event by the import code using the unique fields listed above.

Fields used to define the Unique Index in the Analyses table.
All lookup values in an EDD being import MUST have a match in the appropriate lookup table. The most common field causing errors is QC Code however, you may encounter others like the missing Basis code shown below. You may also find multiple missing lookups and/or multiple pages* of problems, especially when importing data from a new lab or project.
After completing the initial steps to import an EDD file, you may see the EDIT IMPORT FILE form with errors or problems listed. If there are errors, they will be in the ImportProblem field on the form below .
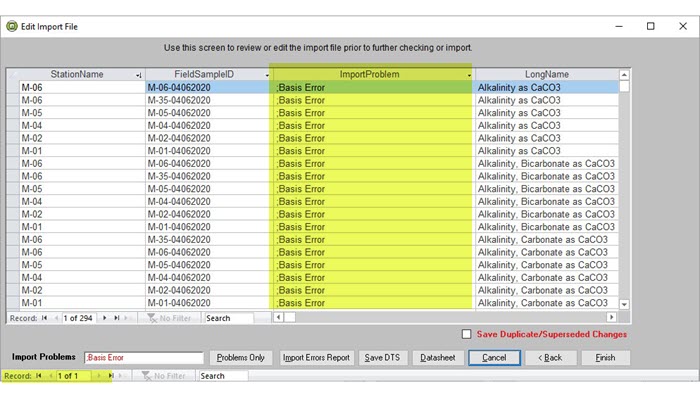
In the case above, there is a value for "Basis" in the EDD file being imported that is not in the Basis table. To find the problem code, scroll right in this form until you find the Basis (or your problem) field and determine what the flagged value is. You will need to stop the import, correct the EDD file and try the import again.
If the problem is a missing value in one of the lookup tables, you will have to stop the import and add the missing value. You can add (or edit) the missing/incorrect lookup values from the EDITOR --> Manage Lookups and click on the button for the table with the problem. (You may have to click the Show More. in the MANAGE LOOKUPS form to find the specific lookup table button you need.)
Once all corrections have been made, try the import again.
* WARNING: Check the Access Record Counter in the lower left of the EDIT IMPORT FILE form highlighted above to see if there are additional error pages.
If you have imported an EDD and received a large number of Duplicated or Superseded records, you probably should undo the import file and learn more about how Duplicates and Superseded results are handled in Enviro Data before trying to import them again.
Undoing an import is simple and can be done by going to the Import Wizard form and clicking on Undo A Previous Import. This will display a list of EDDs imported where you can select the problem file. Before clicking the Undo Selected Import button be very careful that you select the correct file and that you have a copy of the file being deleted so you can re-import it later. Typically, all you need to do is to select a different choice from the Duplicates & Supersedes radio buttons for a new import.
An explanation of how Duplicates and Supersedes are handled follows.
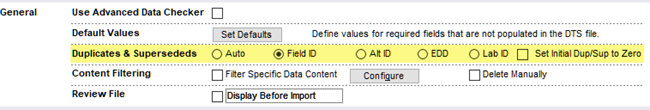
Enviro Data allows duplicated data at both the sample and analysis levels. The Duplicates and Supersedes section of the Import Wizard - Data Checking Options form provides several options for handling of duplicated data. If you do not have the Duplicate and Superseded fields correctly populated in your import file, you MUST select one of the following options, which uses additional fields to determine duplicate samples.
Options for Duplicates
Auto - This option looks for unique samples based on StationName, SampleDate_D (without time), SampleMatrixCode, SampleTop, DuplicateSample, SampleBottom, FilteredSampleCode and QCSampleCode or LabSampleID (if QCSampleCode is ‘Unknown’). If all of these are the same for the next sample, then the DuplicateSample field is incremented.
The recommended import format contains a QCSampleCode field. The import logic utilizes this field for ordering and assigning the DuplicateSample number. Enviro Data groups samples by the unique fields, orders the records based on the DuplicateOrder field in the QCCodes table, then increments the DuplicateSample number by comparing the QCSampleCode of each sample. These codes can be entered by the lab or by the data administrator before import. If the QCSampleCode is not known or is left blank, it defaults to “Unknown”. The code then compares the LabSampleID numbers of each sample to set the DuplicateSample number.
Field ID - This option looks for unique samples based on StationName, SampleDate_D (with time), SampleMatrixCode, SampleTop, SampleBottom, DuplicateSample, FilteredSampleCode, QCSampleCode and FieldSampleID. If QCSampleCode is ‘Unknown’ then it just looks at FieldSampleID. If all of these are the same, the DuplicateSample field is incremented.
Alt ID - This option looks for unique samples based on StationName, SampleDate_D (with time), SampleMatrixCode, SampleTop, SampleBottom, DuplicateSample, FilteredSampleCode, QCSampleCode and AltSampleID. If QCSampleCode is ‘Unknown’ then it just looks at AltSampleID. If all of these are the same, the DuplicateSample field is incremented.
For these import options, correctly assigning QCSampleCode is crucial to identifying original vs. QC data as the QCSampleCode field is used to correctly identify original data vs. QC data.
Clients who are dealing with large amounts of QC and multiple samples per day may want to consider removing the Duplicate = 0 and Superseded = 0 defaults on the SELECT DATA screen. If you need to remove this, be aware that this will be changed back to the default with any new program updates. Call Geotech for more information about changing this program feature.
If you are importing data with QC sample information, you must populate the DuplicateOrder field in the QCCodes lookup table before importing. The Import Wizard uses this field to set your duplicate values based on the duplicate order. For example, if the duplicate order for your QC codes were Original = 1, Duplicate = 2, and Split = 3, then for samples with those codes you would end up with duplicate sample numbers of 0, 1, 2 respectively.
EDD - The next option uses the duplicate and superseded values as they are contained in the import file. Use this option if whoever is providing you with the data sets the values correctly in the EDD.
Lab ID - The final option uses the laboratory identification number from the import file to determine duplicates and superseded values.
Set Initial Dup/Sup to Zero - This option sets both the Duplicate and Superseded fields to zero prior to import.
Options for Superseded Analyses
Superseded values for are set using the unique key of SampleNumber, ParameterNumber, Superseded, AnalyticMethod, LeachMethodCode, ReportUnitsCode, Basis, FilteredAnalCode, QCAnalysisCode and LabSampleID. Unless the EDD option is checked, when a new analysis is imported matching this unique key is imported, the Superseded field for the original analyses is incremented.
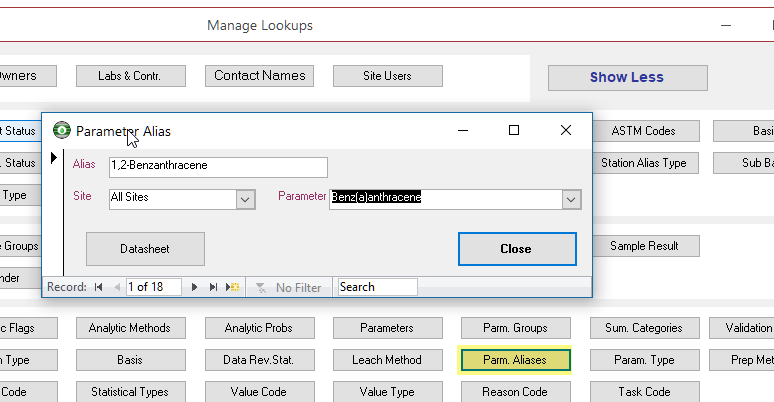
During an import, the wizard checks to see if all the parameters are found in the Parameters table. If a match for each parameter was not found using the options shown below, Enviro Data then displays the parameter match screen to assist with assigning valid parameter names. This form allows you to specify alternate spellings, or aliases, for parameter names for use during import and output. These values are specified the same way as other lookup values, using the Parameter Aliases button on the MANAGE LOOKUPS form. The intention of this feature is to handle situations where the laboratory reports the parameter using a different spelling from the one in the Parameters table. An example would be an alias of 1,2-Benzanthracene for Benz(a)anthracene. It is not intended to intercept misspellings, although it is sometimes used this way. Entries in the ParameterAliases table can either have a site associated with them, in which case the alias is used only for that specific site, or can have a site number of zero, in which case it is used for all sites.
This import check is Accomplished by checking the spelling or CAS number (if the Use CAS Numbers option has been selected). Just be careful using the CAS number option as the CAS number may not be unique or standard for a specific parameter. You can also import by Other Parameter ID (such as STORET) if you are using this field.
![]()
If some parameters could not be found in your database, you will be presented with a list of these. You are given the option to either match the "new" parameter to an existing one, add the parameter, or create an alias for an existing parameter.
It may be best at this point to take a screen shot of this list and then cancel out of the import. Using this list, you can research to determine if each is already in the Parameters table under a different name. If so, you can then create an alias for that parameter either during your import or using the PARAMETER ALIAS form accessed from Manage Lookups.
If you find new parameter that is not in your database, it needs to be added either manually or during the import.
On occasion, an import file will not import either producing an error, showing many duplicate / superseded results, or having some other problem. Sometimes these issues can be hard to track down. The most common issues are "ImportProblem" error/problem, bad dates, missing lookup data, and occasionally a corrupted Excel file.
If you get to the EDIT IMPORT FILE form and see errors of problems in the ImportProblems form see the FAQ on How do I fix an "Import Problem" error/problem during import.
The rest of this section will provide a few steps that might help identify and eliminate other types of problems.
If the EDD is not in the correct format, you may see the error message below. There are many available import formats so first and foremost, make sure you have selected the appropriate format in the File Type and Format box on the IMPORT WIZARD form that matches your lab's file. While Version 8 will import an EDD in the DTS2012 format, you still have to select that format.
When the import file does not precisely match one of the supplied formats, you may be able to use one of the two User-Defined formats might do the job. These are Columnar and Crosstab. The former can be an Excel or delimited file while the latter is an Excel file.
We recommend that an Excel EDD file only contain a single worksheet unless multiple worksheets are specifically supported for the chosen import format. If the file you are attempting to import has multiple worksheets and/or the first worksheet in that file is not in a recognized import format you can see the error below.
Setting up your EDD file in order to check it for problems
If your file is in one of the supported formats but you are still having problems, you can use the steps below to organize the EDD in Excel to help identify the problem(s).
Since most of these steps require some knowledge of Excel, we have prepared a 5:30 min YouTube video. troubleshooting_edd_setup.mp4, to assist you in performing the steps below. (Note that the video does not follow the exact steps sone. Also, when recording the video, each time Ithe video was paused, Excel lost focus and we had to re-select the entire sheet.) If you are familiar with Excel, you likely can skip the video.
- Open the DTS Import file that you are checking in Excel.
- Make a note of the bottom-right or last cell in this spreadsheet. This would be the bottom row number and the far right column number.
- Click inside the spreadsheet and using the keyboard press the CTRL and Home keys together to place the cursor in cell A1.
- Now press CTRL and END keys together. This should take you to the cell identified in Step 2 above. If it does not, the spreadsheet needs to be fixed to remove these "extra empty" data cells before importing. These cells could be extra rows and/or extra columns.
- Insert a blank row into row 1.
- Open the import example file for the import format being used. This might be C:\Enviro\Edata8\DTSFormat2012.xls or C:\Enviro\Edata8\DTSFormat8.xlsx depending on your import format.
- Highlight the top row with the field header names in the example file and Copy it.
- Back in your import file, in the blank top row you created above, Paste the example DTS header you just copied.
- This will give you two rows of headers, a correct set in Row 1 and the original ones in Row 2.
- Click in the upper left-hand corner of the spreadsheet to select all records.
- All records must be selected for the following steps through 14 to complete correctly.
- Right click in any cell and select Format Cells then in the Alignment tab make sure Wrap text is not checked.
- Right click in any one of the columns (A, B, C, etc.) and choose Unhide so all columns are displayed. (If all records are not still selected go to step 8.)
- Right click in any one of the rows (1, 2, 3, etc.) to display any hidden rows. (If all records are not still selected go to step 8.)
- Change the font and font size to something easy to read. We personally like Calibri 11 or 12.
- Turn on Filter. (All columns should now show a Filter dropdown.)
- Double click one of the dividing lines in the header between columns to resize each column so all contents are displayed (without text wrapping)
- Compare EACH columns header in Row 1 to the original header in Row 2 and correct any errors.
- Note, if you have selected the wrong example format header or, your import format is non-standard, you will need to take extra steps to resolve this.
- Check to make sure each required field identified by RED font is populated.
- Using Filtering and Sorting to compare the data in the file to make sure it matches the required format.
- If all the header names are present and correct, but they are not in the correct order or you are missing some, you may have to use the User-Defined format.
Correct Headers - If the header row has incorrect fields due to spelling, you really should contact your lab to have them supply the EDD in the correct format. However, if you need the file imported in a hurry, the User-Defined Columnar Excel/CSV import will allow you to map the incorrect fields to ignore the order and/or misspellings.
Formatting of Columns -All the data in each column must be the same data type. You can check this by highlighting a column and right-clicking in the header cell and choosing Format Cells. This will tell you what the data type is for that column. If the column should be Date, that should be the format shown. If not, you may need to change the format. You can sometimes see a formatting problem simply by looking at the data in the column. For example, if there are mixed number and text values, you will see this by the justificaiton of the content. See the example below.
To correct this error, highlight the entire AnalyticMethod column then right-click the AnalyticMethod column and select Format Cells. On the Number tab of the Format Cells form change the Category from “Number” to “Text”, and then click OK and make sure you save your file.
Special Characters - Some characters or symbols can cause problems when used in your data. The issue is that Access may treat them a reserved program code. The primary character that causes problems is the single quote symbol that can also represent a foot symbol, but there are others. See the FAQ https://staging.geotech.com/resources/faq/using-geotech-software/general-questions/are-there-reserved-symbols-in-ms-access-that-will-cause-problems for more information.
Dates – Date fields require special attention because Access can be problematic when importing dates from Excel. Dates in incorrect formats need to be corrected prior to import. This can be done with your import file in Excel. First click once above the SampleDate_D (or other date field) header to select the entire column. Next, right-clicking on one of the dates and choose Format Cells. In the Format Cells form you can then select Date in the Category window and the type of date in the Type window.
Null (Blank) Dates -- All normal samples should contain the sample date in the SampleDate_D field. Many times however the lab will not include a sample date for lab QC samples. There are two ways to work around this. If the sample in questions is truly a lab QC sample just check the Allow Null Dates (shown below) in the Samples section of the Import Wizard - Data Checking Options form, The other way is to copy one of the lab dates (LabRecvDate_D or AnalDate_D) into the SampleDate_D field.
Filtering – You can use Excel's Filter function to see what data is in each column and also filter and/or sort it. To set up filtering, click in the upper left-hand portion of the spreadsheet (above the 1 for rows and to the left of A for columns) to select all cells in the worksheet. Next, on the Home ribbon, click on Sort & Filter and choose Filter. By applying filters to each column missing or incorrect data can be identified. Once a column is filtered, use the dropdown arrow in the column you wish to exam to view the contents. If Blanks are shown, uncheck Select All and then check blanks to see if data is missing, or if this is just an empty row of data.
Sorting – Once a Filter is set, you can sort the columns individually, both in ascending and descending order, by clicking on the drop down at the top-right of each column. By sorting, you can verify that the data range is accurate, there are no alphabetic characters in date or numeric field and that all (required) fields are populated correctly. Blanks should also come to the top when a column is sorted in ascending order.
Duplicate / Superseded issues - We recommend checking to see if the FieldSampleID, the LabSampleID or AltSampleID fields are populated. If they are, choose the most appropriate one of those other fields in the first Import Wizard form for instead of using Auto.
Glitches in the File – At times, there can be a problem in the data that cannot be seen visually. These are usually caused by some data corruption in the file. Saving the file in a comma delimited CSV format and importing it in that format may correct these glitches.
Copying to Another File – As a last resort, you can copy the data into a new spreadsheet, taking care to only select the cell range that only contain your results.
User-Defined Import - Many times an import file may have missing fields in the header, or one or more field names is spelled wrong. When this happens, you can use the User-Defined import with either an Excel or CSV file.
If you are unable to import your file after going through the above checks, Geotech Support can assist you in resolving the import issue(s).
The last two data levels in Enviro Data are Samples and Analyses. These are generally imported together using an Electronic Data Deliverable (EDD) file from your lab. This is convered in depth in the Getting Started and Documentation available from either the EDITOR or VIEWER main screen and in the EDITOR Tour. The steps shown below are general and provide an overview of the process.
1. Using one of the DTS format files, such as DTSFormat8.xls, as a template, create an Excel sheet with your samples and results information. SuccessfulImport8.xls is an example that you can consult when populating your own import files. These files are located in the Enviro\Edata8 folder in your directory. Notes: All lookup code columns with red captions must be populated. You may use “z” as a default code for lookups (SampleTypeCode, etc.) SampleTop, SampleBottom, DuplicateSample and Superseded can be left blank or default to zero. If you have digital data in a columnar format, but different from one of the Enviro Data DTS formats, you can use the User-Defined Excel option in the Import Wizard. Contact Geotech if you need help with that.
2. After constructing your import file, click on Import Data on the EDITOR MENU.
3. Select the File Type and Format that matches your import file format.
4. Click Select at the right of the File Path and Name text box. Navigate to the file you made and click Open.
5. Click Finish.
6. The HELP MATCH STATIONS form may open if there’s a discrepancy in spelling Station names. You can use the dropdown on the right to find the correct station, or click Add Station to add a new station, if needed. After matching stations click Finish.
7. Help screens for matching or adding new parameters and matching reporting units may appear if needed.
8. When all is correct the import will run to completion and provide a summary of what was imported. Additional report screen may be displayed if they were selected. .
Regulatory Limits
Sometimes you might want a specific report to compare your results to limits from different regulatory limit types. For example, you might need to compare metals to Federal drinking water standards, but organics to State standards. Or you might want to compare each result to multiple limit types. Regulatory limit groups help you do this.
When creating Regulatory Limit Group names, be aware that both the Limit and the Limit Group are selected for reporting from the same place, Selected Limit combo box in the DISPLAY OPTIONS form, so make sure you choose names that will distinguish between limit types and limit groups. We recommend that when creating Reg. Limit Groups that you give them a distinctive name, so you will recognize that you are choosing a group. An underline character “_” at the beginning of the group name will help with that. Again, limit names should be kept short, so they do not exceed the combo box and make it difficult to distinguish one name from another.
To enter or edit regulatory limit groups, click on Reg. Limit Groups on the MANAGE LOOKUPS form. You can advance through the groups using the Access controls at the bottom left of the form. The REGULATORY LIMIT GROUPS form is shown in the figure below.
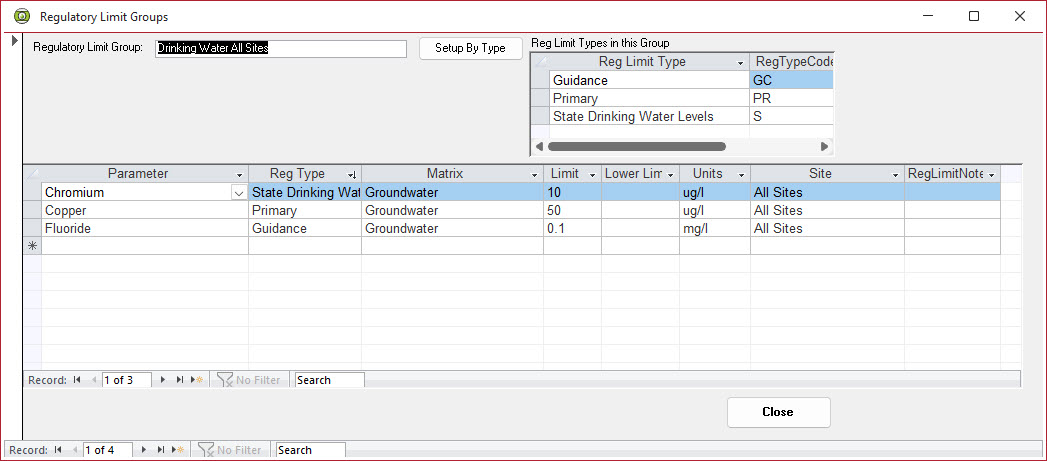
To create a new group, navigate to a new blank record using the Record control in the bottom left. At the top of the form enter the name for the group. If you need to add Reg. Limit Type, use the Setup By Type button and add them one at a time. The Setup By Type button lets you take all of the limits for a particular regulatory limit type and assign them to a regulatory limit group.
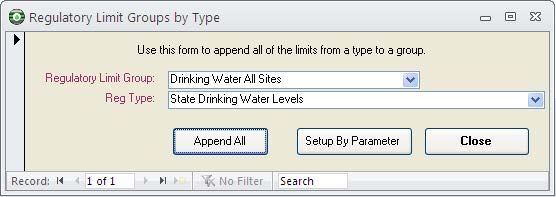
This can be useful if you want a group to have most of the limits from one type, and then a few from a different type, or make a group that has all the limits for several types.Then for each type, enter as many limits as you wish by selecting from the combo box.
Regulatory Limits let you compare the incoming data to one or more currently selected regulatory limits to see if any of your data exceed regulatory standards. Of course, you will have to have entered (or imported) the regulatory limits that you want to compare to. Depending on the report, you may apply up to 12 regulatory limits to your data. Where you wish to compare one of more set of limits, you have to setup Regulatory Limit groups for the limits you have entered.
In Enviro Data you can enter the limits into the program, or import them from a spreadsheet file, which may be easier, especially if you have them in digital form.
There are two parts to setting up the limits - creating the limit types and entering the limits.
From the EDITOR, click on Manage Lookups in the Setup group and click on Reg. Limit Types.
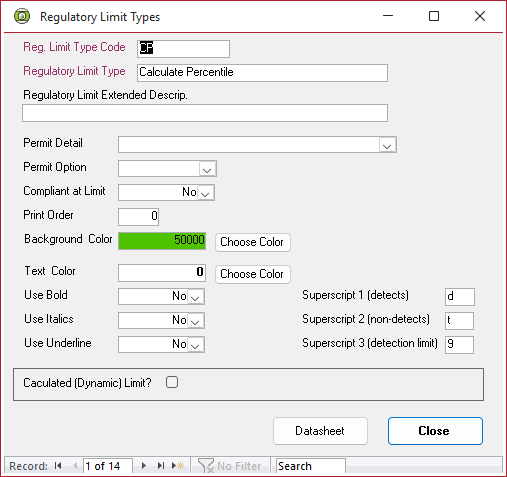
This will bring up the Regulatory Limit Types form where you can add the regulatory limit type that you will be adding limits for. You can also set several options for how the limit will be displayed when a limit is exceeded. These include any permit options, whether you wish to display an exceedance when the result is at or exceeding the regulatory limit, the report order that will be used for various limit types, the background color when a limit is exceeded and various font options.
For example, you could enter “FA” for the Reg. Limit Type Code, and “Factory” for the Regulatory Limit Type. Then click on Close. Fill out the Activity Log and click on Done. Close the Manage Lookups form.
Now that we have entered the limit type we can import the limits.
Enviro Data comes with spreadsheet files that make it easy to import your limits. ImportRegLimits.xls is an empty file in this format, and ImportRegLimitsExample8.xls contains some example data. Fields in red font are required fields. Of course, the RegTypeCode and RegType must be the same as you entered above.
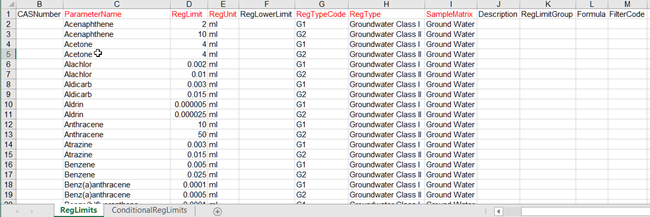
Open the ImportRegLimits8.xls file and enter some limit data. Save the file under a new name, and close Excel.
Select Import Data from the Editor Import / Edit section. This will open the form seen below.
Select “Reg Limits Import” from the dropdown box under File type and format. Use the Select button to browse for and select the file you created.
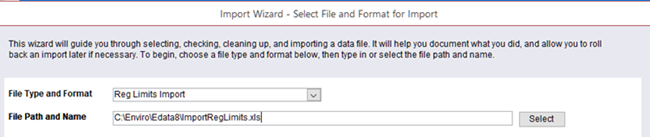
The remaining options in the Import Wizard apply only to analytical data import, so we don’t need to go through them.
Click on Finish to proceed with the import, then OK. You will see a popup telling you how many limits were imported.
You don’t have to import the limits before you import your samples and analyses. In fact, you don’t need limits at all unless you want to use them in your retrievals.
Beginning with Version 8D, reg. limits can now be tied to specific Stations.
For a better understanding of Regulatory Limits and Regulatory Limit Groups we recommend you see the section on Regulatory Limits in the Basics section of the User Documentation.
The crosstab report will display up to 12 limits but to display multiple regulatory limits in a crosstab or other report that supports them, you must first setup a regulatory limit group and then add the limits you require to this group. When creating groups, we recommend naming your group in a way you can identify it as a group such as using an “_” (underscore character) in front of the name to differentiate a single limit from a group.
Additionally, you must have checked the Display Reg Limits check box shown below.
For more information see the FAQ on Why are my regulatory limits not showing up in reports or exports?
Regulatory Limits contain multiple required fields that must be matched with your data for them to work as expected. Several of the most common issues that will prevent them from being used in reports or exports like the crosstab are summarized below. Note however, the required settings in Reports and the Exports (like the Crosstab) must also be set correctly.
Sample Matrix Does Not Match the Sample or Not Set
The sample matrix of the reg. limit must match the matrix of the sample being compared for a comparison to be made. If the sample was imported with a Sample or Lab Matrix different from the regulatory limit, then no comparison can be made. The most common example of this is where the lab EDD uses a matrix of "Water" when the sample matrix is "Groundwater". This will need to be corrected either in the Sample or Analysis data.
The matrix for each individual parameter can be changed in the Editor --> Manage Lookups --> Parameters. If the Matrix needed is not shown, click on "Unknown" and using the dropdown select the correct Matrix and Units and click on OK. (Note that Unknown will simply be moved down one row when this is done.)
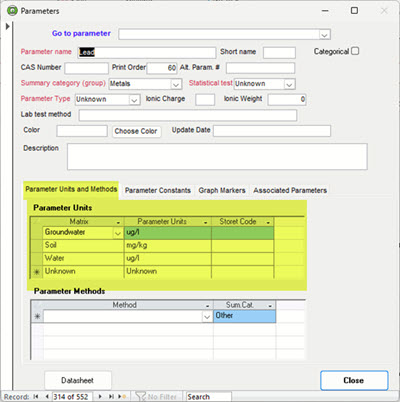
If you need to change the data and the data has recently been imported, the easiest option is to Undo the import, correct the EDD and reimport. Otherwise, you will need to Edit either the Sample or the Analyses data.
If the Regulatory Limits have the incorrect Matrix, you can edit this by clicking on the Regulatory Limits button in the Editor and next clicking on the Reg Limits button. This opens the Edit Regulatory Limits form where you can filter for the desired limits and then use the dropdown in the Matrix column to make changes.
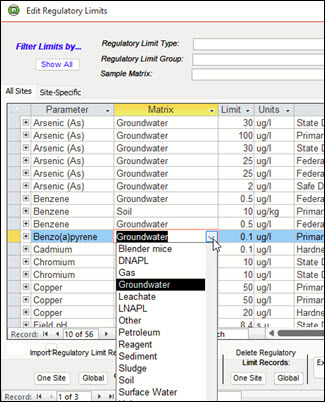
Reporting Units Can’t be Converted or No Conversion Available
While Enviro Data will attempt to convert both the analytical and reg. limit units to match to what is set in Parameter Units. If there is no conversion factor in the Unit Conversion table, the reg. limits with those units will be ignored because the reg. limit and analyses units do not match. The most common example is where a soil parameter with a unit of kg/mg is being compared against the same parameter but for ground water with a unit of ug/L.
If a conversion had not been setup, one can add a unit conversion from the Editor --> Manage Lookups --> Unit Conversion (under Multiple Tables).
Null (Blank) Values
One other problem is where a reg. limit was created without providing a limit value in the RegLimit (value) field. This can be a little tricky to detect and correct but below are two ways to find and fix these.
Editing Records in RegLimits Table
- The quickest way to find null reg. limits is to find and open the RegLimits table by pressing the F11 function key on your keyboard to open the object viewer in Access. (If the Tables is not selected, click the drop-down in the upper right and select "Tables" as shown below.)
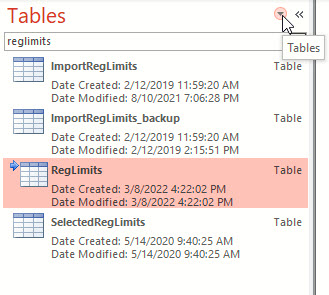
Finding the RegLimits table in Access.
- Use the drop down in the Limit field and Filter for Blank records as shown below.
- You can either correct or delete these records as needed, However, ensure that you filtered on the correct field, and that only records with no value in the Reg.Limits field are deleted.
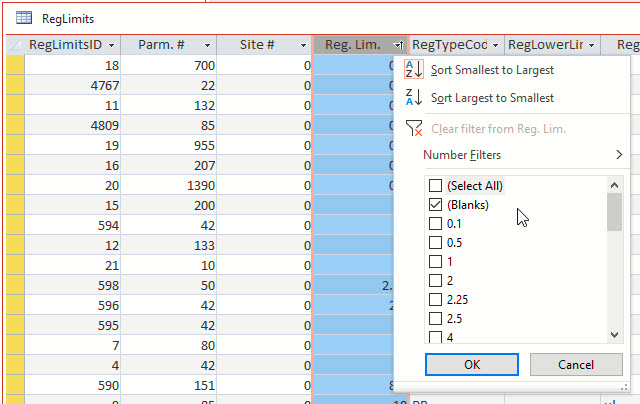
Setting a filter to select only blank Reg. Limit records in the RegLimits table.
Editing Records using Edit Regulatory Limits form
- In the Editor, click on Regulatory Limits and then Limits in the Setup group to open the Edit Regulatory Limits form. In that form, click on the drop-down icon in the Limit column as shown below and select Sort Smallest to Largest. This will bring all those with no value to the top of the list.
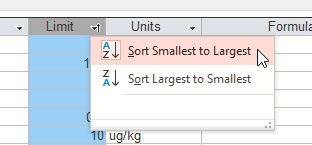
Sorting records in the Edit Regulatory Limits form.
- Scroll to the right a few rows at a time using the scroll bar at the bottom of this table until you can see both the Limit and Enabled columns in your screen.
- Turn off each of these “nulls” by unselecting them in the Enabled column.
- Note that there are two tabs on this form (highlighted on the left). These are for limits at All Sites or Site-Specific If you have limits for each, you need to do this for repeat Step 3 for each tab.
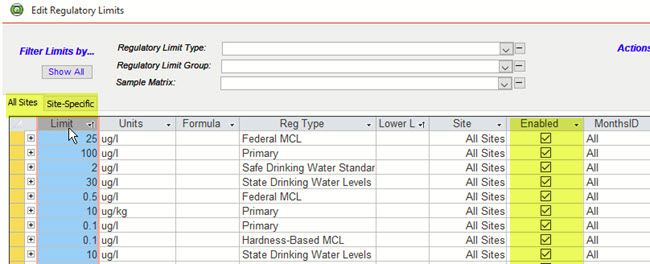
Enabling or turning off Reg. Limits in the Edit Regulatory Limits form
The Reg Limit Text dropdown on the Grouping / Formatting tab of the Crosstab Wizard form can be used to display text for a Reg. Limit in a Crosstab export. However, before you can do this you need to go to the Editor's Manage Lookups --> Reg Limits and enter an asterisk or a note into the RegLimitNotes field shown below.
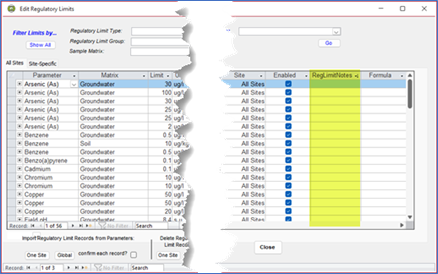
Figure 1 - Edit Regulatory Limits form showing the RegLimitNotes field where you can add an asterisk or note for a Crosstab export.
Once you have created the note for the specific reg. limit desired, you then need to use the Reg Limit Text tool to select how you want to display it. The choices are shown in the figure below. Since you are using Reg. Limits, you should also check the Display Reg Limits and Print Reg Limit Legend check boxes to display them.
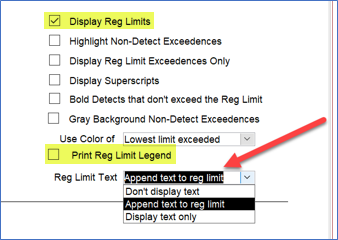
Figure 2 – The Reg Limit Text dropdown on the Grouping / Formatting tab of the Crosstab Wizard form.
However, this only works when you use Value and Flag for the output as shown below. If you select only Value (which is a numeric field), the Reg. Limits will not display.
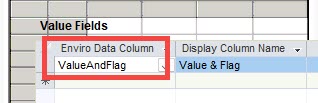
Figure 3 – Selection of Value and Flag is required to show text on Reg. Limits.
You will still need to add some text explaining what the notation means to the Crosstab Template you have selected.
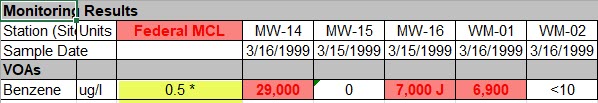
Figure 4 –Crosstab export showing the use of i (highlighted) and exceedances in red.
Upgrading / Database Conversion
This error can occur after installing Enviro Data 8 on a computer with an older version of MS Office. Please see How do I fix an Object Library Error or Missing or Broken Reference Error? for a simple fix.
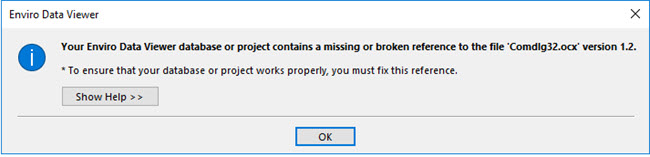
An Enviro Data database contains a complex set of tables each with specific structures and requirements for their fields. Each minor upgrade, 8C to 8D for example, Imay have new tables, fields, in some cases increased referential integrity and checking of your data during the upgrade.
Before starting, if you are trying to upgrade an old table that you have not used in a while and are not sure what version format it is in, you need to determine that first. You can do that by opening the database in Access, pushing the F11 key on your keyboard (which opens the table listing) and then opening the Versions table. The table's version number should be shown in the first record. If it is an Enviro Data 2012 table, it can be updated simply by attaching to it in the Editor and following the prompts. Databases used with version 2010 or older will need to be converted in steps to the next version and then to version 2012 before upgrading to Version 8.
If your database is older than Version 2012, please contact Geotech Support. for assistance.
If you are using a recent version, and simply upgrading to a newer version. simply open your new Editor, attach to your database, and follow the directions.
Checking Structure Updates
To ensure that everything is converted correctly, Enviro Data 8 displays an Update Structure Summary showing the number of records in the main tables both before and after the conversion. The example below shows the main tables before being converted. (Note that the other tables are also being updated in the process but only the main ones are shown.)
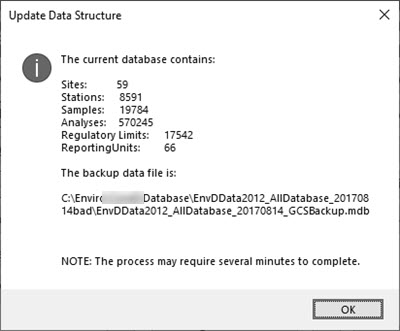
If the structure in one or more of these tables violates data integrity, possibly because it had been modified, or some other problem, this will cause the conversion to be flawed but the resulting database will still be attached to the Editor. When this happens, you will see in the form shown below that one or more “Converted” tables do not contain the same number of records that the “Initial Record Count” showed.
YOU MUST PAY CLOSE ATTENTION TO THE UPDATE STRUCTURE SUMMARY FORM TO MAKE SURE YOUR DATA WAS CORRECTLY CONVERTED.
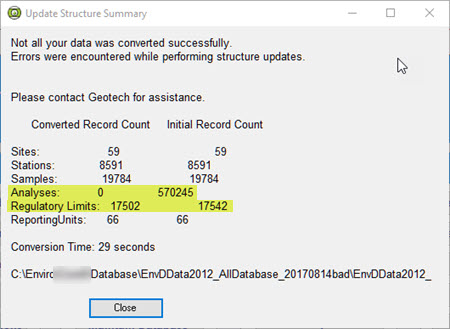
In the above case, an extra field had been added to the Analyses table by the client. Additionally, the RegLimitType table contained some records with descriptions that were not unique.
The issue Geotech encounters the most when upgrading a database to the Ver. 8 format is where a client has modified one or more of the tables in Enviro Data by adding additional fields. In the case above, the extra field in the Analyses table was simply deleted. the non-unique descriptions were modified, and the database was able to be converted.
A more difficult issue to find is a problem in a lookup table. If a lookup table fails to convert. You will not see it listed, but this problem will prevent a related table to not be converted with other tables dependent on it. Most lookup tables contain a field for both a code and for the code’s description. And all these descriptions must be unique in Version 8. This was not required in Ver. 2012.
Another example is where a RegUnit in the RegLimits table has a code for a unit that does not exist in the ReportingUnits table. To identify this can require creating a query with the relationship between the table in question and the appropriate lookup table.
So far, the other most common problem of this type has been in the RegLimitTypes table where limits were imported from a spreadsheet with a RegType that exceeds the 50 characters limit that the field can hold. This means the RegType (the description), is truncated and is now identical to one for a different reg. limit. The easiest way to find these is to open the table in question, sort the description field alphabetically and look for long descriptions that match. The fix is to abbreviate them to 50 or fewer characters and make them unique. In the example below (from the same database as above) the Reg. Limits had been imported with some of their descriptions longer than 50 characters. When these were truncated, they became identical. See below, and how they were corrected.
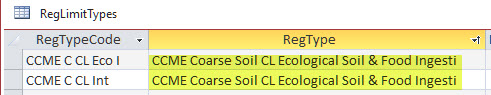
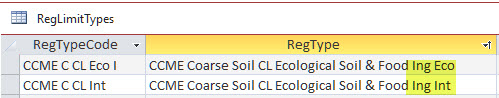
This fix also applies to other lookup fields where the descriptions may not be unique. The issue is figuring out which tables to check. You can get a clue of which lookups to check based on which of main table (starting with Sites) that did not convert correctly. For example, if the Stations table had a problem, check the lookups shown under Stations using Manage Lookups in the Editor. In the example above, you probably don’t have to check every Station lookup, only those in the “Show Less” tab of the form.
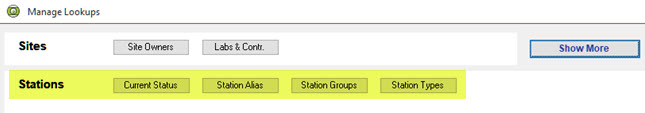 View each lookup in Datasheet view sort the description field and look for identical values and correct any you find. Then move on to the next lookup table for the appropriate table. If you can’t find the problem there, you can click Show More and check more of the Stations lookups.
After a successful upgrade, we recommend moving the new Version 8 database into the C:\Enviro\EData8 folder if you are working on a local copy.
When you start the conversion process the source database is copied with “_GCSBackup” appended to the file name. Additionally, the source database is not touched at all, so you have two backup copies.
If after reviewing the above you still need assistance, please contact Geotech Support.
In the new Enviro Data 8 database file structure, changes have been made to several of the tables to enhance functionality. This means that any 2012 databases you have been using will need to be converted into the new format.
While we recommend using the EDITOR and VIEWER programs that are consistent with the database version in use, an Enviro Data 8 database can be used with the Enviro Data 2012B programs. However, there will be errors when creating a new database or subset, and/or preparing lab reference files with the older version.
If you have databases from Version 2010 or older, these will need to be converted into the next newer format before converting to Ver. 8. In other words, a Ver. 2008 database will need to be converted into the 2010 format using the 2010 Editor and a 2010 format will need to be converted using a 2012 Editor before trying to convert it into the Ver. 8 format. If you need assistance with this, please contact support.
Upgrading an Access Database
When you upgrade Enviro Data, you will use the new Enviro Data 8 EDITOR to upgrade your database and, the conversion and the EDITOR must both be run from the EData8 folder with its associated files. Simply open the EDITOR and use Attached Database button to convert you existing current database. This will create a new file with (Version8) added to the end of the file name and also create a backup of your old file.
Convert a SQL Server Database
Your SQL Server databases will need to be converted to the Enviro Data 8 table structure to add several new tables, and new fields to existing tables using scripts. Geotech can perform the upgrade for you during a short WebEx. Please contact support@geotech.com to set this meeting up.
The Enviro Data database file structure changes with each minor version upgrade -- 8C to 8D for example. This is done to enhance functionality. This means that any older Version 8 or 2012 databases you have been using need to be converted into the new format.
While we recommend using the EDITOR and VIEWER programs that are consistent with the database version in use, an Enviro Data 8 database can be used with the Enviro Data 2012B programs. However, there will be errors when creating a new database, a subset and/or preparing lab reference files with the older version database.
Convert an Access Database,
For any Access databases, you will use the Enviro Data 8 EDITOR to make the conversion and the EDITOR must be run from the EData8 folder with its associated files. This can be done by simply opening the EDITOR and use Attached Database button to convert the older database. This will create a new file with (Version8) added to the end of the filename and also create a backup of your old file. The original file will remain unchanged.
Convert a SQL Server Database
Any SQL Server databases will need to be converted to the Enviro Data 8 table structure that matches the version being used. This conversion adds several new tables and fields to the existing database using scripts. Geotech can perform the upgrade for you during a short Teams meeting or, provide the scripts to your IT Dept. Please contact support@geotech.com to set up this meeting.
While we recommend using the EDITOR and VIEWER programs that are consistent with the database version in use, an Enviro Data 8 database can be used with the Enviro Data 2012B programs. However, there will be errors when creating a new database or subset, and/or preparing lab reference files with the older version. If you need to do these tasks, and do not have a Version 8 program available, contact Geotech Support for assistance.
Converting an Older Enviro Data Database
Introduction
Before beginning, please read this entire Introduction section down to Specific Steps for Conversion.
When first using a new version of Enviro Data, or if needing to upgrade an Enviro Data database used with an older version of Enviro Data, it must first be converted. This generally involves adding any new tables and/or new fields to your old database.
An Enviro Data database contains a complex set of tables each with specific structures and requirements for their fields. When newer versions are released, changes are generally made to the database structure including adding tables, fields and specific properties of fields. In Version 8, In order to protect the data integrity, we have also increased referential integrity by checking of the data in may tables during this upgrade.
If you are trying to upgrade a database that you have not used in a while and, you are not sure what version it is in, you need to determine that first. You can do this by opening the database in Access and on your keyboard click the F11 key which opens the table listing. Make sure you are in the table list and then open the Versions table. The database's version number should be shown in the first record. However, if you have been actively using this database and have just upgrade your Enviro Data program you will not need to do this.
If this database is in the MS Access .MDB format, follow the directions below. However, if the databse to be converted is a SQL Server database, a special proceedure must be followed to upgrade it to the newest Enviro Data 8 table structure since the new tables and/or new fields must be added using SQL scripts. Geotech can perform the upgrade for you during a short Teams meeting. Please contact Enviro Data SQL Conversion Support to set this meeting up.
Note that if your database is Version 2010 or older, you must first convert it to a 2012 version format. If you need assistance with this, please contact Enviro Data 2010 or Older Conversion Support.
Specific steps for Conversion
For version 2012 or earlier version of the 8 format, simply attach to the database in the latest version of the Editor. This is done by opening the Editor and clicking on Attach Database on the main Editor form to open the Attach Database form and select the target database usig the Select Access File button.
If the database you are attaching to does not need a conversion, you will simply be attached to it. If however, it does not meet the criteria for the new version of your Editor, you will get the following error message.
Note this in the example below, we are upgrading a Version 2012 database.
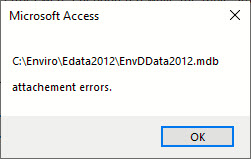
Click OK and you will see the Update Structure form. Clck OK to continue or Cancel to cancel the conversion.
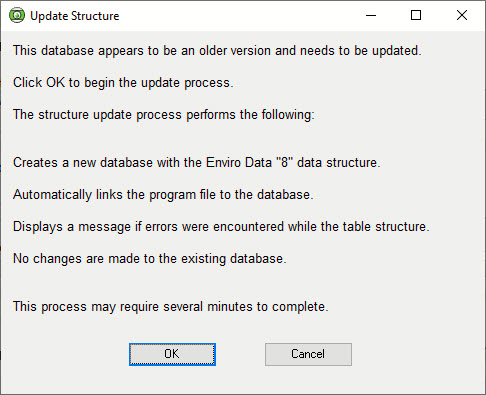
Note that you may see slightly different working in the form above if you are converting a Version 8 database, but the rest of the steps are the same.
Click OK and Enviro Data makes a copy of your database is created in the same folder but with "GCSBackup" appended to the file name. For this example, the backup file was named EnvDData2012_GCSBackup.mdb
You will also be presented with a summary of the number of records in the main Enviro Data tables. Note that you will have a chance to review these in the next form.
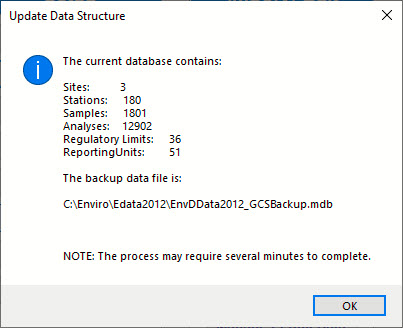
Click OK to start the conversion.
When the conversion has completed you will see a comparison of the tables from above along with the number or records actually converted.
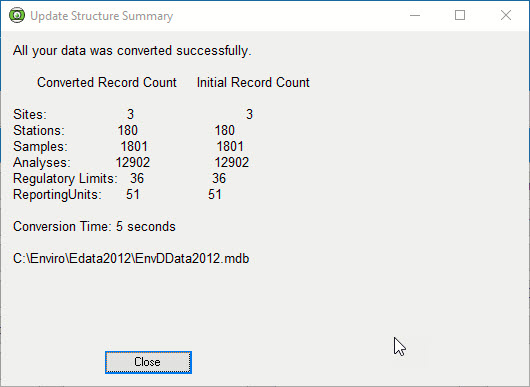
CAREFULLY CHECK THE RECORD COUNTS FOR EACH TABLE AS THEY MUST MATCH. If they do not match, see the FAQ Why weren’t all of my tables converted when I upgraded to Enviro Data Version 8? - Geotech Computer Systems, Inc.
If these record counts match, the conversion was successful. The converted file is stored in the original folder with "(Version8)" appended to the name. In this example the new file was named EnvDData2012(Version8).mdb.
Error Messages
When you open a database, Access creates a "Lock file" with the extension ".LDB". When you close a database, that lock file should be removed but an error can prevent this.
Try following the steps in the FAQ Is there anything else I have to do after installing Enviro Data? (You should have already done this anyway.)
If you are unable to fix this error, contact support@geotech.com.
The Crosstab Export in Enviro Data Version 2012 B 1.987 and Version 8 uses Microsoft Visual Basic for Applications (VBA) in Excel to create the final spreadsheet report. When the export is run, a VBA macro attempts to set or get the printer page setup properties for the sheet(s) in the Excel workbook. If a printer is not installed, an error will occur as Excel cannot set the page setup properties. See here for more details.
To correct this error when you already have a printer installed, you need to make that printer the default. If you do not have an installed printer, add a printer to Windows and make it the default printer. We recommend setting as a printer the Microsoft Print to PDF.
To change or set the printer In Windows 10 open Settings --> Devices --> Printers & Scanners and select/install a printer. Generally, you should let Windows 10 manage the default printer. To allow this, check the check box shown at the bottom of the figure below.
In older versions of Windows, the settings to add a printer and make it the default may be found in the Control Panel.