
Enviro Data ships with many prepared reports available from the Select Data form’s Report button. These are often referred to as the “canned” or “Access” reports and have been created using MS Access. Specific requirements and example queries on how to run these reports are provided in Appendix C – Reports of the User Documentation.
The instructions below are to create one of the common run reports in Enviro Data, the Periodic Regulatory Report with Limits. This report requires that Regulatory Limits are set in the Display Option form as shown below. You can access this by clicking on Display Options at the top-center of the Select Data form. It is near the bottom of the form.

To run this report, click on the Save/Load tab, select "9 Graphs" from the Saved Query combo box. 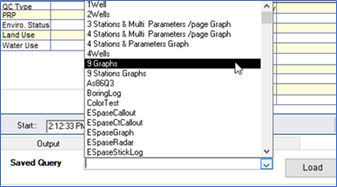
This is a simple set of selected data that will be used for this report. Once you have made the selection, the Report button will be displayed if it was not already shown.
Click on Report to bring up the Select Report form. On the left side of this form are a list of the available reports. (Note that these can be turned on or off from the Editor as needed.) On the right side are screen shots showing the report layout. Use your mouse or the down arrow on your keyboard to move up or down the list. Notice that the previews to the right change as you scroll. There are also Tabs for each report you can use for custom labels. There are about sixty report formats available for different project needs. For example, one report creates a simple boring log display. Several reports let you create multiple graphs on a page of the data selected. Like the one you will be creating, many of the reports are a type of “crosstab” format, such as with samples across and parameters down, or vice versa. (There are other and more complex customizable crosstabs "exports; available elsewhere in Enviro Data.)
Select Periodic Regulatory Report with Limits. You will probably need to scroll down the list to find it.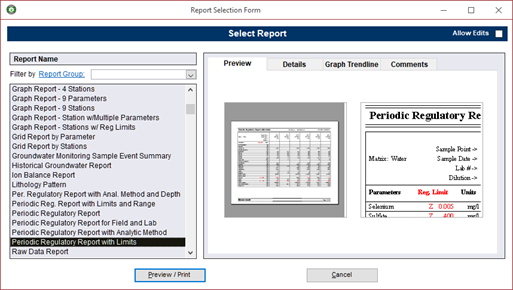
Next click on Preview/Print to build the report.
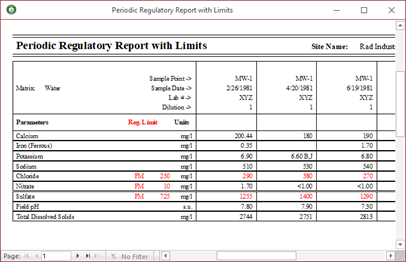
Double-click on the report's title bar at the top of the report. This will maximize the report to fill the entire Access window then click inside the report to zoom in. Since there are multiple pages in this report, you can move through the pages using the Access Record Selector in the lower left of the report. This tool has first, last, page advance and page back buttons. (There is also a new page button for use on other forms.)

In the record selection, click on the last page button “>|” This page also has a legend at the bottom to display the regulatory limit type codes and any analytic flags used in the report.

. Click on the first page button "|< " to return to the first page.
This report highlights several useful features of the software. It highlights regulatory limit exceedances by turning them red. Notice that the second Potassium result shows both the value and the “BJ” flag. Also, many Nitrate values are displayed as “<1.00.” These are examples of the value and flag formatting feature described above. Also, the regulatory limit for pH has both an upper and lower limit. Enviro Data can handle upper limits, lower limits, or both. Finally, note that many the results have trailing zeros, such as “6.90.” Enviro Data helps you display your data with the number of significant figures the result was imported with or the significant figures in the detection limit.
At this point, you can print the report if you want using the Access Print button in the upper left of the Access Menu bar below. You can then choose a printer or print to PDF.

You can close the report preview but clicking Close Print Preview in the Access Menu bar of simply click the X in the upper right.
Because you clicked in the report to maximize it above, that Select Data form looks different as it is now maximized. You can restore it to the original windowed view by clicking on the the Windows control on the second row of icons in the upper-right. 
Note that Enviro Data runs best when program forms are windowed and not maximized.